Milton Markets
Markets
Trading
Company
Partners
Sign InOpen Account
  1. Home/
  2. Market Analysis/
  3. USD/JPY Falls to Mid-149 JPY, Uptrend Enters Adjustment Phase【November 20, 2023】
Koki Ando•Nov 20, 2023

USD/JPY Falls to Mid-149 JPY, Uptrend Enters Adjustment Phase【November 20, 2023】

Koki Ando headshot

Daily Market Analysis

Koki AndoChief Market Analyst

Expert analysis of today's market movements and trading opportunities

Koki Ando headshot

Daily Market Analysis

Koki AndoChief Market Analyst

Expert analysis of today's market movements and trading opportunities

Fundamental Analysis

  • USD/JPY Falls to Mid-149 JPY, Enters Adjustment Phase
  • Focus on whether USD/JPY will break below Ichimoku Cloud’s base and conversion lines, and if RSI falls below 50
  • U.S. stock indices take a breather, despite growing expectations of an end to rate hikes, but are in an overbought range

USDJPY Technical Analysis

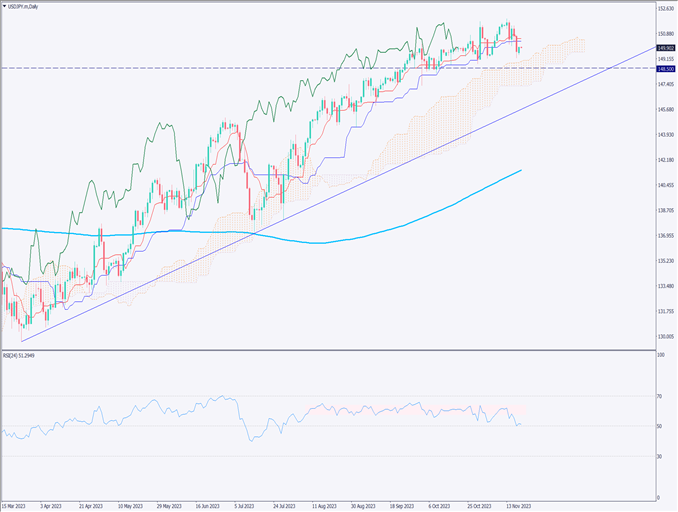
Analyzing the daily chart of the USD/JPY. Movements below Ichimoku Cloud’s base and conversion lines are observed, with early November lows of 148.80 JPY and 148.50 JPY being key levels. RSI is on a gradual downward trend, with breaking below 50 being a crucial indicator for future direction.

If RSI rebounds at 50, there’s a possibility of an upward move. The proximity of the Ichimoku Cloud also suggests it could act as a lower support, making a rapid appreciation of the yen unlikely.

However, considering the sharp drop to 129 JPY in 2022, caution is needed with market movements. This week, with U.S. markets closed for Thanksgiving in the latter half, increased volatility is expected in the first half of the week.

[USDJPY/ D1]

Day Trading Strategy (1-Hour Chart)

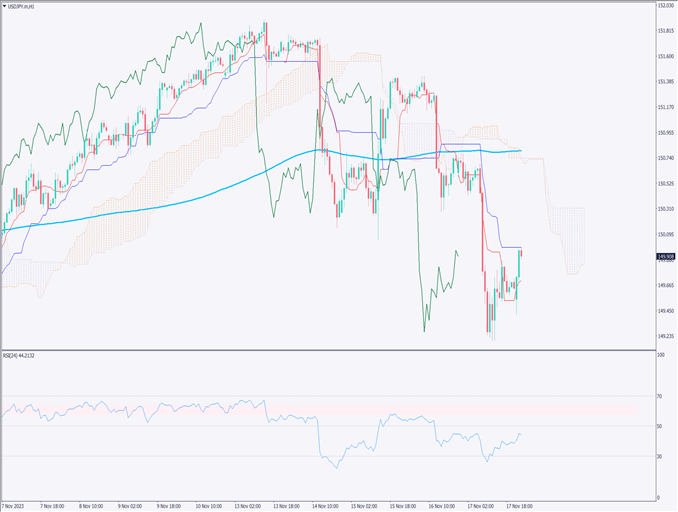
Analyzing the 1-hour chart of the USD/JPY. Currently, the USD/JPY is showing a typical downward trend, having hit a low of 149.19 JPY before rising to 149.90 JPY.

This movement, observed amidst increasing probabilities of the end of the U.S. interest rate hike cycle, indicates instability in the market, as the Bank of Japan has yet to make a move. The daily chart suggests a tendency towards selling.

For day trading, a strategy of selling on rallies is recommended. Entry point at 150.15 JPY, target profit at 148.65 JPY, and a stop-loss line at 150.50 JPY.

Support and Resistance Lines

The resistance line to be considered in the future is as follows

148.50 JPY – A major support line

[USDJPY/ H1]

Market Sentiment

USDJPY – Sell: 52%, Buy: 48%

Today’s Important Economic Indicators

Economic Indicators and EventsJST (Japan Standard Time)
German Producer Price Index16:00

*Trading advice in this article is not provided by Milton Markets, but by Shu Fujiyasu Jr., a certified technical analyst.

Ready to trade?

Open live account

Related Analysis

Can Gold Renew Its Record High?

Can Gold Renew Its Record High?

11 days agoRead more →
USD/JPY: Selling Pressure Dominates on Rallies

USD/JPY: Selling Pressure Dominates on Rallies

7 days agoRead more →
Gold and Silver Continue to Hit Record Highs

Gold and Silver Continue to Hit Record Highs

20 days agoRead more →

This material is for informational purposes only and does not constitute investment advice. Trading leveraged products involves significant risk of loss. Past performance is not indicative of future results.

Share

X

Start trading today

  • Fast execution
  • Competitive spreads
  • 24/7 support
Open live accountView account types
Milton Markets
Twitter/XYouTube

Markets

FOREX
CRYPTO
COMMODITIES
INDICES
STOCKS

Trading

  • Flex Account
  • Smart Account
  • Elite Account
  • MetaTrader 5 (MT5)
  • MetaTrader 4 (MT4)
  • Launch WebTrader
  • Learn Hub
  • Economic Calendar
  • Promotions

Company

  • About Us
  • NDD Technology
  • Customer Protection
  • Execution Conditions
  • Company News
  • Blog
  • Market Analysis

Partners

  • IB Program
  • PAMM Program
  • White Label
  • Investor Login
  • Manager Login

Support

  • Terms of Service
  • Privacy Policy
  • Risk Disclosure
  • Contact Us
  • Help Center
  • My Page Login
Milton Markets is a trading name of Milton Markets Ltd. Milton Markets Ltd. is part of Milton Global and is registered in Saint Lucia (Registration Number: 2023-00166). As part of Milton Global, we adhere to the same high regulatory standards as Milton Global Ltd, which is regulated by the Seychelles Financial Services Authority (FSA) under license SD040.
Risk Warning: CFD trading carries high risk and may not suit all investors. You may lose more than your initial investment. Ensure you understand the risks before trading.
Restrictions: Milton Markets does not provide services to the following countries (not limited to these): United States, Canada, European Union countries, Iran, North Korea, Saint Vincent and the Grenadines, Afghanistan, American Samoa, Belarus, Russia, Burundi, Central African Republic, Congo (Brazzaville), Cuba, Iraq, Lebanon, Liberia, Libya, Myanmar, Puerto Rico, Rwanda, Somalia, Sudan, Syria, US Virgin Islands, Venezuela, Yemen, Zimbabwe, Côte d'Ivoire, Mali, Guinea, Eritrea.
You must be 18 years old or the legal age in your country of residence.
By opening an account, you are considered to have registered of your own volition without solicitation from Milton Markets.
Disclaimer: This website does not constitute investment advice. Content should not be construed as personal advice. Seek independent financial advice.
© 2026 Milton Markets. All rights reserved.
TermsPrivacyCookiesRisk