Milton Markets
Markets
Trading
Company
Partners
Sign InOpen Account
  1. Home/
  2. Market Analysis/
  3. Gold May Form a Ceiling, Downward Trend as US Rate Cut Expectations Fade【December 11, 2023】
Koki Ando•Dec 11, 2023

Gold May Form a Ceiling, Downward Trend as US Rate Cut Expectations Fade【December 11, 2023】

Koki Ando headshot

Daily Market Analysis

Koki AndoChief Market Analyst

Expert analysis of today's market movements and trading opportunities

Koki Ando headshot

Daily Market Analysis

Koki AndoChief Market Analyst

Expert analysis of today's market movements and trading opportunities

Fundamental Analysis

  • US employment statistics exceed market expectations, mixed economic indicator results
  • This week features the FOMC meeting, with interest rate trend forecasts also scheduled to be announced
  • Gold temporarily falls below USD 2000, suggesting a ceiling with the emergence of a candlestick pattern

XAUUSD Technical Analysis

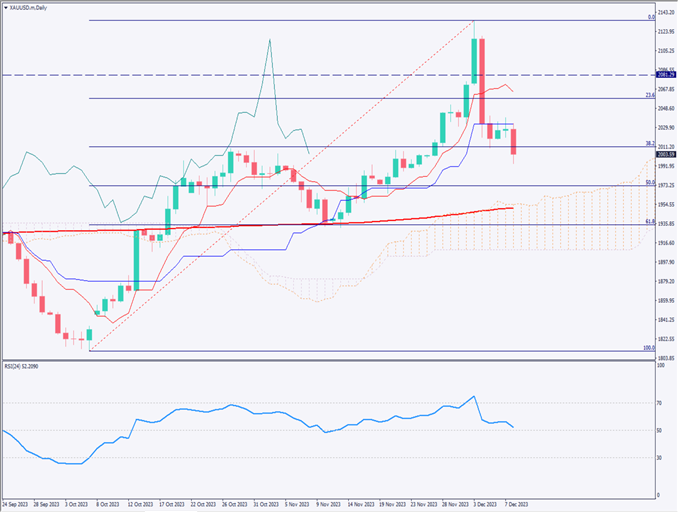
Analyzing the daily chart of the gold market. After updating the historical high, the upward momentum is lost. Excessive rate cut expectations following the US employment statistics are fading, breaking through the lower support line. Currently, it has broken below the 38.2% support line, with a move towards the 50% level, i.e., USD 1972, anticipated.

This week’s US FOMC meeting will announce the policy interest rate and future interest rate trends. This could change the direction of gold. The RSI is moving at 52, and whether it falls below 50 is also noteworthy.

[XAUUSD/ D1]

Day Trading Strategy (1-Hour Chart)

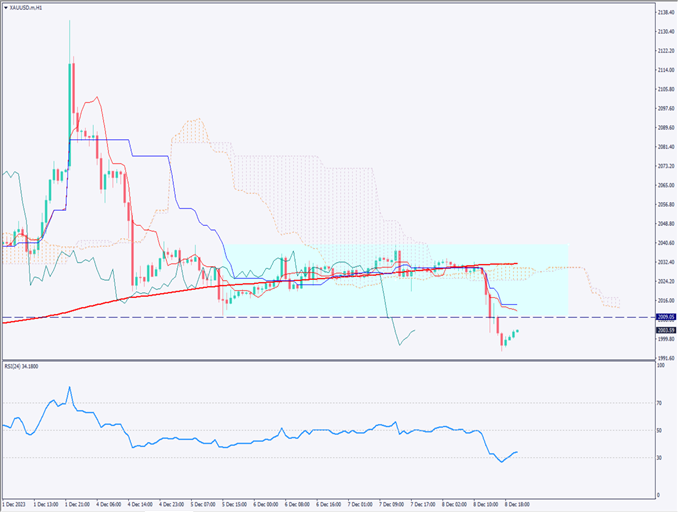
Analyzing the 1-hour chart of the gold market. Currently, it shows a small inverse N-shape, breaking out of the range market downwards. Having fallen below USD 2009.5, there is a possibility of further decline. However, the RSI has exited the oversold zone and is showing a reversal above 30. Therefore, until the RSI reaches 50, some adjustment movement is expected.

The market sentiment is currently balanced, with a clear direction difficult to discern. In the short term, there are opportunities to look for sell entries at the lower range limit. If the price is drawn to around USD 2015, the baseline of the Ichimoku Kinko Hyo, there might be an opportunity for a sell on rally.

As a day trading strategy, consider selling on a rally with an entry at USD 2015, take profit around USD 1990, and a stop loss at USD 2020.

Support and Resistance Lines

Upcoming resistance lines to consider:

2040 USD – Upper range level
2005.50 USD – Lower range level

[XAUUSD/ H1]

Market Sentiment

XAUUSD Sell: 55%, Buy: 45%

Today’s Important Economic Indicators

Economic Indicators and EventsJST (Japan Standard Time)
Japanese Large Manufacturers’ Business Outlook Index8:50

*Trading advice in this article is not provided by Milton Markets, but by Shu Fujiyasu Jr., a certified technical analyst.

Ready to trade?

Open live account

Related Analysis

Gold Remains in a Downtrend, $5,000 Acts as Strong Resistance

Gold Remains in a Downtrend, $5,000 Acts as Strong Resistance

TodayRead more →
USD/JPY Forms a Range — What’s Next?

USD/JPY Forms a Range — What’s Next?

1 day agoRead more →
USD/JPY dips slightly on LDP landslide victory

USD/JPY dips slightly on LDP landslide victory

7 days agoRead more →

This material is for informational purposes only and does not constitute investment advice. Trading leveraged products involves significant risk of loss. Past performance is not indicative of future results.

Share

X

Start trading today

  • Fast execution
  • Competitive spreads
  • 24/7 support
Open live accountView account types
Milton Markets
Twitter/XYouTube

Markets

FOREX
CRYPTO
COMMODITIES
INDICES
STOCKS

Trading

  • Flex Account
  • Smart Account
  • Elite Account
  • MetaTrader 5 (MT5)
  • MetaTrader 4 (MT4)
  • Launch WebTrader
  • Learn Hub
  • Economic Calendar
  • Promotions

Company

  • About Us
  • NDD Technology
  • Customer Protection
  • Execution Conditions
  • Company News
  • Blog
  • Market Analysis

Partners

  • IB Program
  • PAMM Program
  • White Label
  • Investor Login
  • Manager Login

Support

  • Terms of Service
  • Privacy Policy
  • Risk Disclosure
  • Contact Us
  • Help Center
  • My Page Login
Milton Markets is a trading name of Milton Markets Ltd. Milton Markets Ltd. is part of Milton Global and is registered in Saint Lucia (Registration Number: 2023-00166). As part of Milton Global, we adhere to the same high regulatory standards as Milton Global Ltd, which is regulated by the Seychelles Financial Services Authority (FSA) under license SD040.
Risk Warning: CFD trading carries high risk and may not suit all investors. You may lose more than your initial investment. Ensure you understand the risks before trading.
Restrictions: Milton Markets does not provide services to the following countries (not limited to these): United States, Canada, European Union countries, Iran, North Korea, Saint Vincent and the Grenadines, Afghanistan, American Samoa, Belarus, Russia, Burundi, Central African Republic, Congo (Brazzaville), Cuba, Iraq, Lebanon, Liberia, Libya, Myanmar, Puerto Rico, Rwanda, Somalia, Sudan, Syria, US Virgin Islands, Venezuela, Yemen, Zimbabwe, Côte d'Ivoire, Mali, Guinea, Eritrea.
You must be 18 years old or the legal age in your country of residence.
By opening an account, you are considered to have registered of your own volition without solicitation from Milton Markets.
Disclaimer: This website does not constitute investment advice. Content should not be construed as personal advice. Seek independent financial advice.
© 2026 Milton Markets. All rights reserved.
TermsPrivacyCookiesRisk