Milton Markets
Markets
Trading
Company
Partners
Sign InOpen Account
  1. Home/
  2. Market Analysis/
  3. USDJPY Declines, Powell, Chairman of the Federal Reserve, Speaks of Possible Rate Cuts Next Year【December 14, 2023】
Koki Ando•Dec 14, 2023

USDJPY Declines, Powell, Chairman of the Federal Reserve, Speaks of Possible Rate Cuts Next Year【December 14, 2023】

Koki Ando headshot

Daily Market Analysis

Koki AndoChief Market Analyst

Expert analysis of today's market movements and trading opportunities

Koki Ando headshot

Daily Market Analysis

Koki AndoChief Market Analyst

Expert analysis of today's market movements and trading opportunities

Fundamental Analysis

  • In the U.S. FOMC, Chairman Powell Mentions Rate Cuts, Forex Market Sees Weaker Dollar
  • U.S. Stock Indices Surge, Dow Jones Industrial Average Hits Record High
  • USD/JPY Falls to 142 JPY Level, U.S. Rate Cut Speculation Intensifies, Narrowing Japan-U.S. Interest Rate Gap

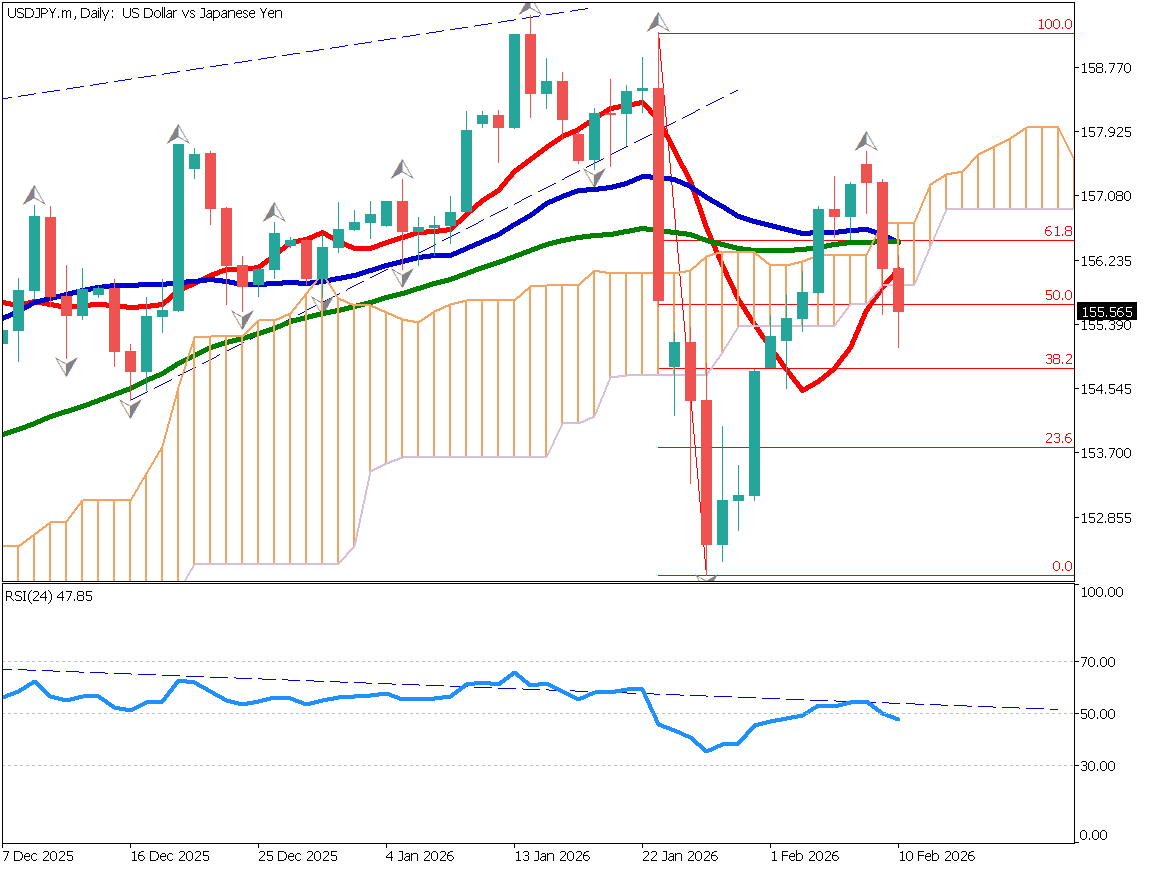
USDJPY Technical Analysis

Analyzing the daily chart of the USD/JPY market. Chairman Powell, in his post-FOMC press conference, mentioned “considering rate cuts in the future,” and the interest rate forecasts of various Federal Reserve Board members were published. As a result, USD/JPY fell to the 142 JPY level, breaking below the 200-day moving average. In the Fibonacci Expansion, 141.98 JPY corresponds to 161.8%, and 141.60 JPY is the recent low.

Attention is focused on how market expectations for rate cuts based on the intentions of the FOMC participants will impact the market. In particular, the recent low of 141.60 JPY could be a crucial point.

[USDJPY/ D1]

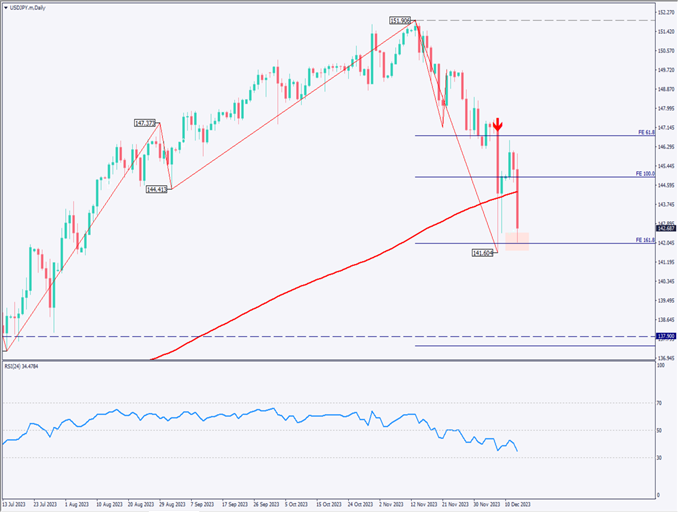
Day Trading Strategy (1-Hour Chart)

Analyzing the 1-hour chart of the USD/JPY market. The RSI is at 23, clearly in an oversold state. The recent low of 141.60 JPY is a key point, and whether it breaks this level is the focus going forward.

In the short term, there may be short covering, but in the long term, the market is expected to move downwards as the view of a narrowing interest rate differential between Japan and the U.S. spreads. The trading strategy is to sell on rallies, waiting for the RSI to exceed 30 and recover to 40-50. There could be a chance to sell on a rally around 144.50 JPY.

Considering the current weak dollar situation, the market may adjust once and then strengthen its downward movement, so consider selling on a rally at that timing.

Support and Resistance Lines

Upcoming resistance lines to consider:

144.72 JPY – Key Price Level
141.60 JPY – Recent Low

[USDJPY/ H1]

Market Sentiment

USDJPY Sell: 49%, Buy: 51%

Today’s Important Economic Indicators

Economic Indicators and EventsJST (Japan Standard Time)
Australian Employment Statistics9:30
UK Policy Interest Rate Announcement
(Expected: Unchanged)
21:00
ECB Monetary Policy Announcement22:15
U.S. Retail Sales22:30
ECB Press Conference22:45

*Trading advice in this article is not provided by Milton Markets, but by Shu Fujiyasu Jr., a certified technical analyst.

Ready to trade?

Open live account

Related Analysis

USD/JPY dips slightly on LDP landslide victory

USD/JPY dips slightly on LDP landslide victory

7 days agoRead more →
USD/JPY Forms a Range — What’s Next?

USD/JPY Forms a Range — What’s Next?

1 day agoRead more →
USD/JPY: Selling Pressure Dominates on Rallies

USD/JPY: Selling Pressure Dominates on Rallies

7 days agoRead more →

This material is for informational purposes only and does not constitute investment advice. Trading leveraged products involves significant risk of loss. Past performance is not indicative of future results.

Share

X

Start trading today

  • Fast execution
  • Competitive spreads
  • 24/7 support
Open live accountView account types
Milton Markets
Twitter/XYouTube

Markets

FOREX
CRYPTO
COMMODITIES
INDICES
STOCKS

Trading

  • Flex Account
  • Smart Account
  • Elite Account
  • MetaTrader 5 (MT5)
  • MetaTrader 4 (MT4)
  • Launch WebTrader
  • Learn Hub
  • Economic Calendar
  • Promotions

Company

  • About Us
  • NDD Technology
  • Customer Protection
  • Execution Conditions
  • Company News
  • Blog
  • Market Analysis

Partners

  • IB Program
  • PAMM Program
  • White Label
  • Investor Login
  • Manager Login

Support

  • Terms of Service
  • Privacy Policy
  • Risk Disclosure
  • Contact Us
  • Help Center
  • My Page Login
Milton Markets is a trading name of Milton Markets Ltd. Milton Markets Ltd. is part of Milton Global and is registered in Saint Lucia (Registration Number: 2023-00166). As part of Milton Global, we adhere to the same high regulatory standards as Milton Global Ltd, which is regulated by the Seychelles Financial Services Authority (FSA) under license SD040.
Risk Warning: CFD trading carries high risk and may not suit all investors. You may lose more than your initial investment. Ensure you understand the risks before trading.
Restrictions: Milton Markets does not provide services to the following countries (not limited to these): United States, Canada, European Union countries, Iran, North Korea, Saint Vincent and the Grenadines, Afghanistan, American Samoa, Belarus, Russia, Burundi, Central African Republic, Congo (Brazzaville), Cuba, Iraq, Lebanon, Liberia, Libya, Myanmar, Puerto Rico, Rwanda, Somalia, Sudan, Syria, US Virgin Islands, Venezuela, Yemen, Zimbabwe, Côte d'Ivoire, Mali, Guinea, Eritrea.
You must be 18 years old or the legal age in your country of residence.
By opening an account, you are considered to have registered of your own volition without solicitation from Milton Markets.
Disclaimer: This website does not constitute investment advice. Content should not be construed as personal advice. Seek independent financial advice.
© 2026 Milton Markets. All rights reserved.
TermsPrivacyCookiesRisk