Milton Markets
Markets
Trading
Company
Partners
Sign InOpen Account
  1. Home/
  2. Market Analysis/
  3. USD/JPY Dips to 141 JPY, Falls Below 200-Day Moving AverageDaily Market Report【December 15, 2023】
Koki Ando•Dec 15, 2023

USD/JPY Dips to 141 JPY, Falls Below 200-Day Moving AverageDaily Market Report【December 15, 2023】

Koki Ando headshot

Daily Market Analysis

Koki AndoChief Market Analyst

Expert analysis of today's market movements and trading opportunities

Koki Ando headshot

Daily Market Analysis

Koki AndoChief Market Analyst

Expert analysis of today's market movements and trading opportunities

Fundamental Analysis

  • ECB Holds Interest Rates Steady at 4.0%, States “It’s Too Early for Rate Cut Expectations” in Announcement
  • Bank of England Keeps Interest Rates Steady at 5.25%, Comments in Statement that “Inflation Battle Is Halfway Done”
  • USD/JPY Falls to 141 JPY as Dollar Weakens Amid Rising Expectations for Fed Rate Cut

USDJPY Technical Analysis

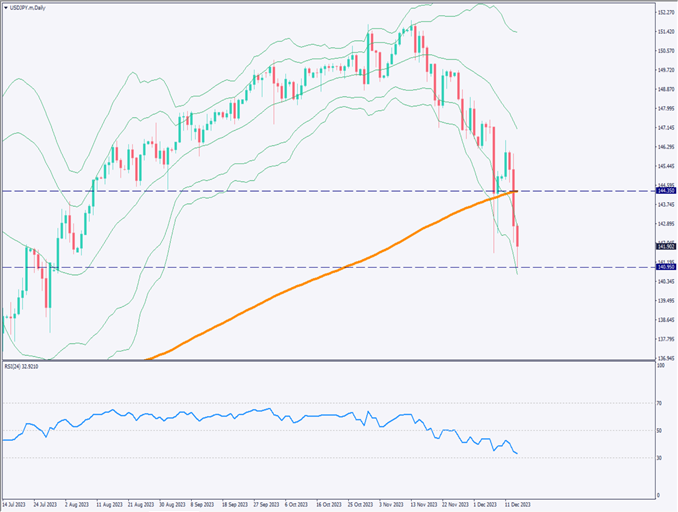
Analysis of the USD/JPY daily chart shows that for the first time in about seven months, it has clearly fallen below the 200-day moving average, moving between -2σ to -3σ on the Bollinger Bands. This suggests the possibility of a band walk. Although there is a rebound at the monthly milestone price of 140.95 JPY, the RSI is at 32, approaching an oversold level.

With a general weakening of the dollar in the forex market, USD/JPY is susceptible to selling pressure. Whether this downward trend continues until next week’s Bank of Japan policy meeting is a focus.

[USDJPY/ D1]

Day Trading Strategy (1-Hour Chart)

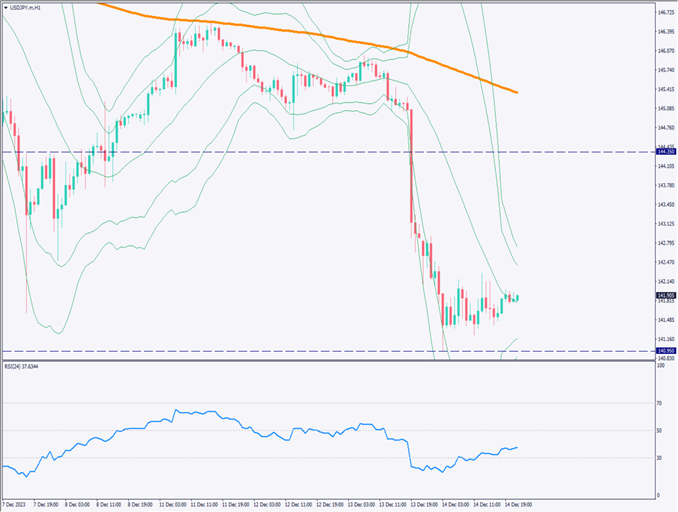
Analysis of the USD/JPY 1-hour chart. The recent low of 141.60 JPY has been breached, falling to 140.95 JPY. This 140.95 JPY level is a strong monthly support zone, with a potential fall to the 130s JPY next year. The RSI was 15 when it dropped to 141.60 JPY, but was 19 during the drop to 140.95 JPY, later recovering to around 37. This divergence, with the price falling and the RSI value rising, can be considered.

Day trading approach: considering the downward trend, favor selling on rallies. Sell entry around 143.50 JPY, take profit at 142.15 JPY, stop at 144.50 JPY. U.S. stock prices are overbought, and selling pressure could increase tonight.

With the Christmas holiday approaching and trading volume expected to decrease over the weekend, the focus is on short-term, cautious trading.

Support and Resistance Lines

Upcoming resistance lines to consider:

144.35 JPY – Monthly milestone price
140.95 JPY – Monthly milestone price

[USDJPY/ H1]

Market Sentiment

USDJPY Sell: 38%, Buy: 62%

Today’s Important Economic Indicators

Economic Indicators and EventsJST (Japan Standard Time)
EU Manufacturing Purchasing Managers’ Index (PMI)18:00
Services Sector Purchasing Managers’ Index (PMI)23:45

*Trading advice in this article is not provided by Milton Markets, but by Shu Fujiyasu Jr., a certified technical analyst.

Ready to trade?

Open live account

Related Analysis

USD/JPY dips slightly on LDP landslide victory

USD/JPY dips slightly on LDP landslide victory

7 days agoRead more →
Gold Remains in a Downtrend, $5,000 Acts as Strong Resistance

Gold Remains in a Downtrend, $5,000 Acts as Strong Resistance

TodayRead more →
Gold and Silver Continue to Hit Record Highs

Gold and Silver Continue to Hit Record Highs

20 days agoRead more →

This material is for informational purposes only and does not constitute investment advice. Trading leveraged products involves significant risk of loss. Past performance is not indicative of future results.

Share

X

Start trading today

  • Fast execution
  • Competitive spreads
  • 24/7 support
Open live accountView account types
Milton Markets
Twitter/XYouTube

Markets

FOREX
CRYPTO
COMMODITIES
INDICES
STOCKS

Trading

  • Flex Account
  • Smart Account
  • Elite Account
  • MetaTrader 5 (MT5)
  • MetaTrader 4 (MT4)
  • Launch WebTrader
  • Learn Hub
  • Economic Calendar
  • Promotions

Company

  • About Us
  • NDD Technology
  • Customer Protection
  • Execution Conditions
  • Company News
  • Blog
  • Market Analysis

Partners

  • IB Program
  • PAMM Program
  • White Label
  • Investor Login
  • Manager Login

Support

  • Terms of Service
  • Privacy Policy
  • Risk Disclosure
  • Contact Us
  • Help Center
  • My Page Login
Milton Markets is a trading name of Milton Markets Ltd. Milton Markets Ltd. is part of Milton Global and is registered in Saint Lucia (Registration Number: 2023-00166). As part of Milton Global, we adhere to the same high regulatory standards as Milton Global Ltd, which is regulated by the Seychelles Financial Services Authority (FSA) under license SD040.
Risk Warning: CFD trading carries high risk and may not suit all investors. You may lose more than your initial investment. Ensure you understand the risks before trading.
Restrictions: Milton Markets does not provide services to the following countries (not limited to these): United States, Canada, European Union countries, Iran, North Korea, Saint Vincent and the Grenadines, Afghanistan, American Samoa, Belarus, Russia, Burundi, Central African Republic, Congo (Brazzaville), Cuba, Iraq, Lebanon, Liberia, Libya, Myanmar, Puerto Rico, Rwanda, Somalia, Sudan, Syria, US Virgin Islands, Venezuela, Yemen, Zimbabwe, Côte d'Ivoire, Mali, Guinea, Eritrea.
You must be 18 years old or the legal age in your country of residence.
By opening an account, you are considered to have registered of your own volition without solicitation from Milton Markets.
Disclaimer: This website does not constitute investment advice. Content should not be construed as personal advice. Seek independent financial advice.
© 2026 Milton Markets. All rights reserved.
TermsPrivacyCookiesRisk