Milton Markets
Markets
Trading
Company
Partners
Sign InOpen Account
  1. Home/
  2. Market Analysis/
  3. Bank of Japan Does Not Indicate Exit Strategy, USD/JPY Temporarily Reaches 144 JPY【December 20, 2023】
Koki Ando•Dec 20, 2023

Bank of Japan Does Not Indicate Exit Strategy, USD/JPY Temporarily Reaches 144 JPY【December 20, 2023】

Koki Ando headshot

Daily Market Analysis

Koki AndoChief Market Analyst

Expert analysis of today's market movements and trading opportunities

Koki Ando headshot

Daily Market Analysis

Koki AndoChief Market Analyst

Expert analysis of today's market movements and trading opportunities

Fundamental Analysis

  • Bank of Japan decides to continue its large-scale monetary easing policy, dispelling some expectations for a rate hike
  • US Federal Reserve officials caution against expectations for rate cuts, but the market anticipates five rate cuts next year
  • Nasdaq updates its highest value, S&P 500 also approaches its peak

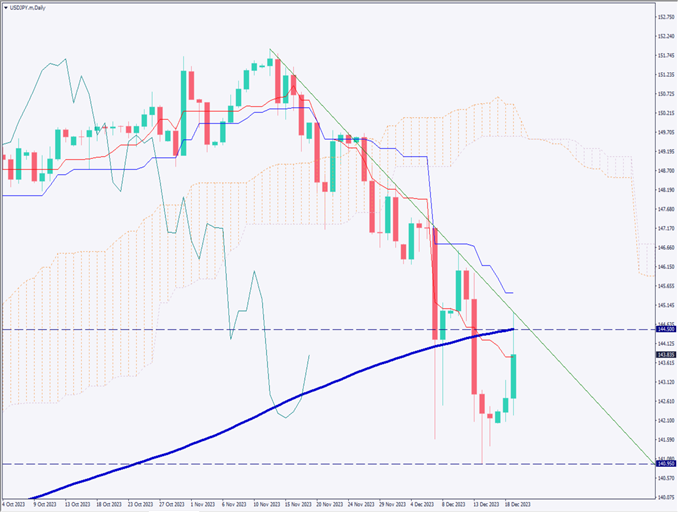
USDJPY Technical Analysis

Analyzing the daily chart of the USD/JPY exchange rate. The Bank of Japan has decided to continue its large-scale monetary easing, and the governor did not indicate an exit strategy, tilting towards yen selling and USD/JPY rising. However, a sharp rise like before is unlikely, as the US Federal Reserve leans towards rate cuts from next year onwards.

Currently, the 200-day moving average is acting as a resistance line, and the conversion line of Ichimoku Kinko Hyo is also a resistance line. Therefore, movements in the late 143 JPY range are observed. Given the Bank of Japan’s hesitant stance on rate hikes, a fall below 140 JPY by the end of the year is unlikely. The focus will now be on the battle around the 200-day moving average.

[USDJPY/ D1]

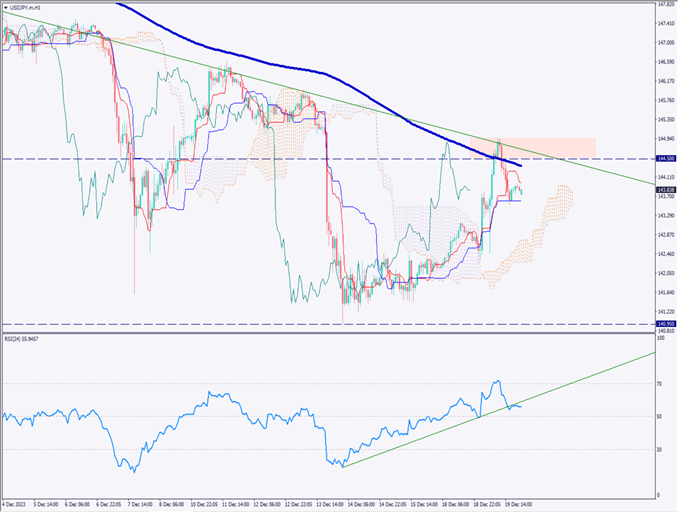
Day Trading Strategy (1-Hour Chart)

Analyzing the 1-hour chart of the USD/JPY exchange rate. Currently, USD/JPY is in an upward trend, with the base line of Ichimoku Kinko Hyo acting as a support line. There is a 240 moving average on the upside, and the market is searching for the next direction.

RSI analysis shows it is above 50 but suggests a potential reversal of the upward trend. If the RSI clearly falls below 50, a renewed downward trend may strengthen. Currently, from a broader perspective, the downward trend continues, making short selling effective.

Day trading strategy involves short selling, entry at 144.35–144.50 JPY, take profit at 143.50 JPY, and stop at 145 JPY.

Support and Resistance Lines

Upcoming resistance lines to consider:

144.50 JPY… 50% Fibonacci retracement
140.95 JPY… Recent low

[USDJPY/ H1]

Market Sentiment

USDJPY Sell: 43%, Buy: 57%

Today’s Important Economic Indicators

Economic Indicators and EventsJST (Japan Standard Time)
UK Consumer Price Index16:00
US Consumer Confidence IndexMidnight
US Crude Oil InventoryNext 0:30

*Trading advice in this article is not provided by Milton Markets, but by Shu Fujiyasu Jr., a certified technical analyst.

Ready to trade?

Open live account

Related Analysis

Gold Remains in a Downtrend, $5,000 Acts as Strong Resistance

Gold Remains in a Downtrend, $5,000 Acts as Strong Resistance

TodayRead more →
USD/JPY Forms a Range — What’s Next?

USD/JPY Forms a Range — What’s Next?

1 day agoRead more →
Gold and Silver Continue to Hit Record Highs

Gold and Silver Continue to Hit Record Highs

20 days agoRead more →

This material is for informational purposes only and does not constitute investment advice. Trading leveraged products involves significant risk of loss. Past performance is not indicative of future results.

Share

X

Start trading today

  • Fast execution
  • Competitive spreads
  • 24/7 support
Open live accountView account types
Milton Markets
Twitter/XYouTube

Markets

FOREX
CRYPTO
COMMODITIES
INDICES
STOCKS

Trading

  • Flex Account
  • Smart Account
  • Elite Account
  • MetaTrader 5 (MT5)
  • MetaTrader 4 (MT4)
  • Launch WebTrader
  • Learn Hub
  • Economic Calendar
  • Promotions

Company

  • About Us
  • NDD Technology
  • Customer Protection
  • Execution Conditions
  • Company News
  • Blog
  • Market Analysis

Partners

  • IB Program
  • PAMM Program
  • White Label
  • Investor Login
  • Manager Login

Support

  • Terms of Service
  • Privacy Policy
  • Risk Disclosure
  • Contact Us
  • Help Center
  • My Page Login
Milton Markets is a trading name of Milton Markets Ltd. Milton Markets Ltd. is part of Milton Global and is registered in Saint Lucia (Registration Number: 2023-00166). As part of Milton Global, we adhere to the same high regulatory standards as Milton Global Ltd, which is regulated by the Seychelles Financial Services Authority (FSA) under license SD040.
Risk Warning: CFD trading carries high risk and may not suit all investors. You may lose more than your initial investment. Ensure you understand the risks before trading.
Restrictions: Milton Markets does not provide services to the following countries (not limited to these): United States, Canada, European Union countries, Iran, North Korea, Saint Vincent and the Grenadines, Afghanistan, American Samoa, Belarus, Russia, Burundi, Central African Republic, Congo (Brazzaville), Cuba, Iraq, Lebanon, Liberia, Libya, Myanmar, Puerto Rico, Rwanda, Somalia, Sudan, Syria, US Virgin Islands, Venezuela, Yemen, Zimbabwe, Côte d'Ivoire, Mali, Guinea, Eritrea.
You must be 18 years old or the legal age in your country of residence.
By opening an account, you are considered to have registered of your own volition without solicitation from Milton Markets.
Disclaimer: This website does not constitute investment advice. Content should not be construed as personal advice. Seek independent financial advice.
© 2026 Milton Markets. All rights reserved.
TermsPrivacyCookiesRisk