Milton Markets
Markets
Trading
Company
Partners
Sign InOpen Account
  1. Home/
  2. Market Analysis/
  3. Gold Rises to USD 2,045, Boosted by Increased Expectations for US Interest Rate Cuts【December 22, 2023】
Koki Ando•Dec 22, 2023

Gold Rises to USD 2,045, Boosted by Increased Expectations for US Interest Rate Cuts【December 22, 2023】

Koki Ando headshot

Daily Market Analysis

Koki AndoChief Market Analyst

Expert analysis of today's market movements and trading opportunities

Koki Ando headshot

Daily Market Analysis

Koki AndoChief Market Analyst

Expert analysis of today's market movements and trading opportunities

Fundamental Analysis

  • US GDP Revised Downwards, Adding Wind to Next Year’s Rate Cut Expectations
  • US Dollar Weakens, USD/JPY Falls to the Early 142s
  • Gold Rises, Hitting Resistance at USD 2,045

XAUUSD Technical Analysis

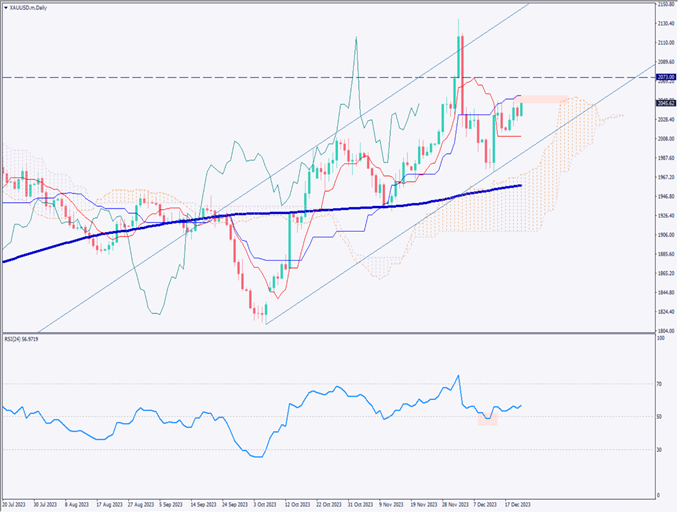
Analyzing the daily chart of gold prices. Currently, gold is firming and rising, supported by expectations of US rate cuts. The chart shows a situation sandwiched between the Ichimoku Kinko Hyo’s standard line and conversion line. Particularly, there is a resistance band between USD 2,045 and USD 2,053, and attention should be paid to the movement exceeding the standard line transitioning to USD 2,053.

Overall, it’s forming a parallel channel and is currently in an upward phase. RSI analysis indicates a rebound at 50, suggesting a continuation of the upward trend. Therefore, the gold market is expected to continue its upward trajectory.

[XAUUSD/ D1]

Day Trading Strategy (1-Hour Chart)

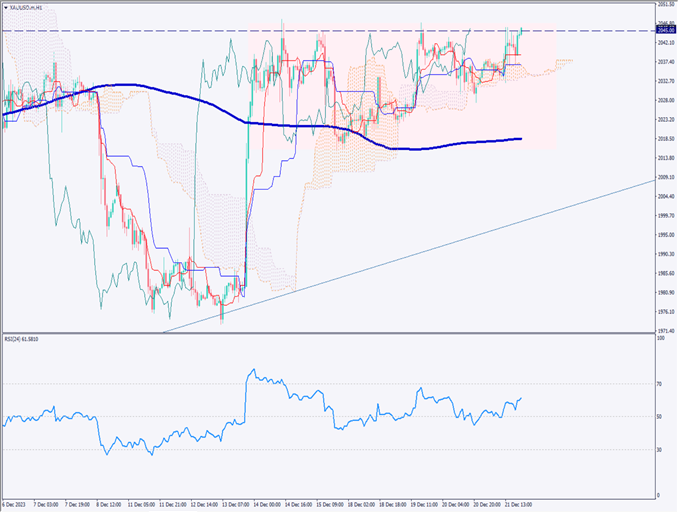
Analyzing the 1-hour chart of the gold market. Currently, gold is forming a large range (rectangle) or an ascending triangle, having failed to break through USD 2,045 three times, but with higher lows, suggesting a high likelihood of an upward breakout.

The RSI stands at 64, indicating a stable upward trend. Expectations for a US rate cut are significantly influencing market fundamentals.

For day trading, after exceeding USD 2,045, confirm that USD 2,045 functions as a support line before considering entry. The profit target is USD 2,053, where the Ichimoku Kinko Hyo’s standard line on the daily chart is transitioning, with a stop if it clearly falls below USD 2,045.

Support and Resistance Lines

Upcoming resistance lines to consider:

USD 2,045 – A significant resistance band

[XAUUSD/ H1]

Market Sentiment

XAUUSD Sell: 64%, Buy: 36%

Today’s Important Economic Indicators

Economic Indicators and EventsJST (Japan Standard Time)
Japan Nationwide Consumer Price Index8:30
UK GDP16:00
Personal Consumption Expenditures Price Index Core22:30
Canada GDP22:30
University of Michigan Consumer Sentiment IndexMidnight

*Trading advice in this article is not provided by Milton Markets, but by Shu Fujiyasu Jr., a certified technical analyst.

Ready to trade?

Open live account

Related Analysis

USD/JPY: Selling Pressure Dominates on Rallies

USD/JPY: Selling Pressure Dominates on Rallies

7 days agoRead more →
USD/JPY Forms a Range — What’s Next?

USD/JPY Forms a Range — What’s Next?

1 day agoRead more →
Gold and Silver Continue to Hit Record Highs

Gold and Silver Continue to Hit Record Highs

20 days agoRead more →

This material is for informational purposes only and does not constitute investment advice. Trading leveraged products involves significant risk of loss. Past performance is not indicative of future results.

Share

X

Start trading today

  • Fast execution
  • Competitive spreads
  • 24/7 support
Open live accountView account types
Milton Markets
Twitter/XYouTube

Markets

FOREX
CRYPTO
COMMODITIES
INDICES
STOCKS

Trading

  • Flex Account
  • Smart Account
  • Elite Account
  • MetaTrader 5 (MT5)
  • MetaTrader 4 (MT4)
  • Launch WebTrader
  • Learn Hub
  • Economic Calendar
  • Promotions

Company

  • About Us
  • NDD Technology
  • Customer Protection
  • Execution Conditions
  • Company News
  • Blog
  • Market Analysis

Partners

  • IB Program
  • PAMM Program
  • White Label
  • Investor Login
  • Manager Login

Support

  • Terms of Service
  • Privacy Policy
  • Risk Disclosure
  • Contact Us
  • Help Center
  • My Page Login
Milton Markets is a trading name of Milton Markets Ltd. Milton Markets Ltd. is part of Milton Global and is registered in Saint Lucia (Registration Number: 2023-00166). As part of Milton Global, we adhere to the same high regulatory standards as Milton Global Ltd, which is regulated by the Seychelles Financial Services Authority (FSA) under license SD040.
Risk Warning: CFD trading carries high risk and may not suit all investors. You may lose more than your initial investment. Ensure you understand the risks before trading.
Restrictions: Milton Markets does not provide services to the following countries (not limited to these): United States, Canada, European Union countries, Iran, North Korea, Saint Vincent and the Grenadines, Afghanistan, American Samoa, Belarus, Russia, Burundi, Central African Republic, Congo (Brazzaville), Cuba, Iraq, Lebanon, Liberia, Libya, Myanmar, Puerto Rico, Rwanda, Somalia, Sudan, Syria, US Virgin Islands, Venezuela, Yemen, Zimbabwe, Côte d'Ivoire, Mali, Guinea, Eritrea.
You must be 18 years old or the legal age in your country of residence.
By opening an account, you are considered to have registered of your own volition without solicitation from Milton Markets.
Disclaimer: This website does not constitute investment advice. Content should not be construed as personal advice. Seek independent financial advice.
© 2026 Milton Markets. All rights reserved.
TermsPrivacyCookiesRisk