Milton Markets
Markets
Trading
Company
Partners
Sign InOpen Account
  1. Home/
  2. Market Analysis/
  3. USD/JPY Declines, Fails to Break Through 200-Day Moving Average【January 9, 2024】
Koki Ando•Jan 9, 2024

USD/JPY Declines, Fails to Break Through 200-Day Moving Average【January 9, 2024】

Koki Ando headshot

Daily Market Analysis

Koki AndoChief Market Analyst

Expert analysis of today's market movements and trading opportunities

Koki Ando headshot

Daily Market Analysis

Koki AndoChief Market Analyst

Expert analysis of today's market movements and trading opportunities

Fundamental Analysis

  • U.S. stock indices surge, with NASDAQ skyrocketing
  • USD/JPY faces resistance at the 200-day moving average
  • A candlestick pattern similar to ‘Evening Star’ appears in USD/JPY

USDJPY Technical Analysis

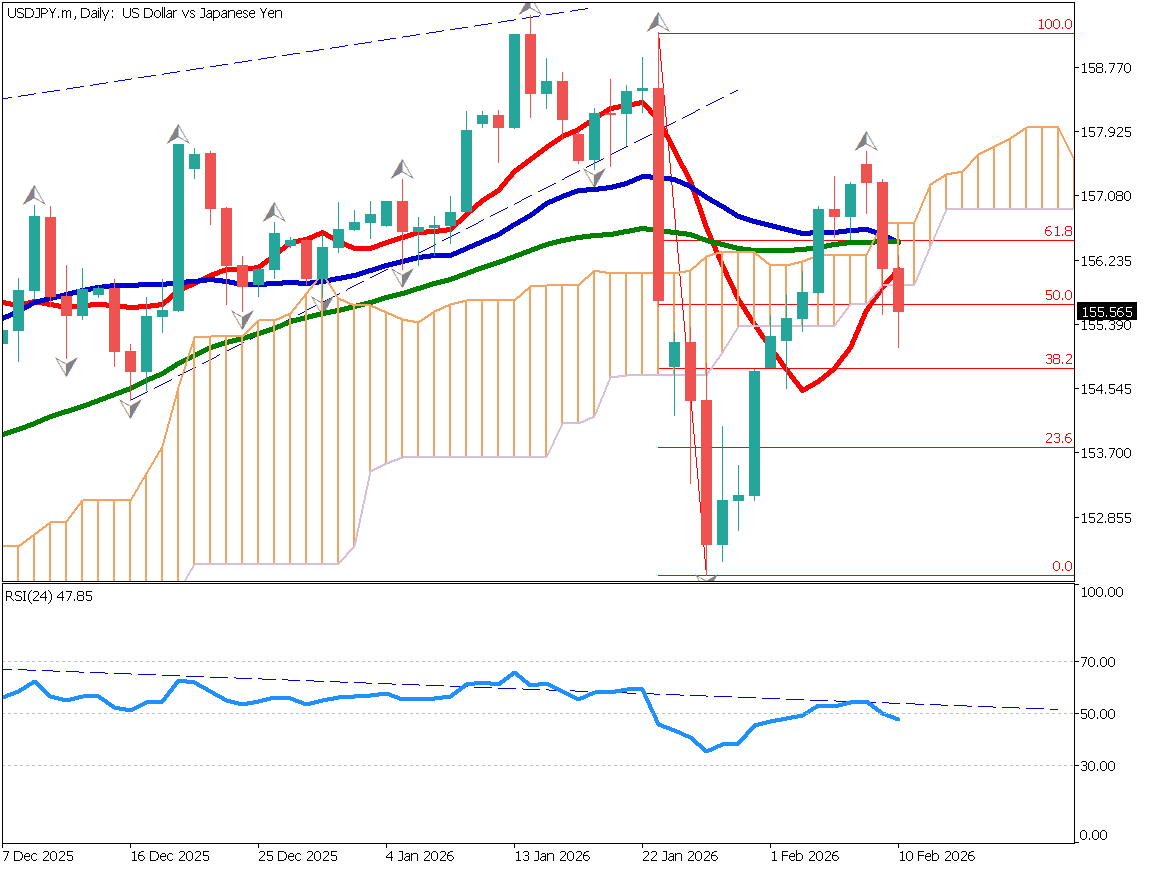
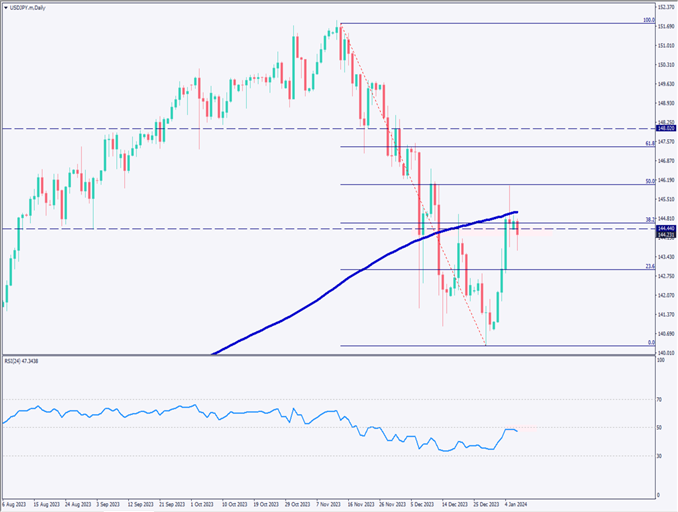
Analysis of the daily chart for USD/JPY shows a decline after failing to break through the 200-day moving average. A pattern with an extended upper shadow is observed, forming an ‘Evening Star’ signal with a sequence of ‘bullish candle + doji + bearish candle’.

Selling pressure is concentrated around the halfway mark of the Fibonacci retracement, intensifying the downward momentum. The RSI is below 50, acting as resistance. Currently, there’s a high possibility of forming a retracement high, with the 23.6% level at 143 JPY being the next critical support zone.

[USDJPY/ D1]

Day Trading Strategy (1-Hour Chart)

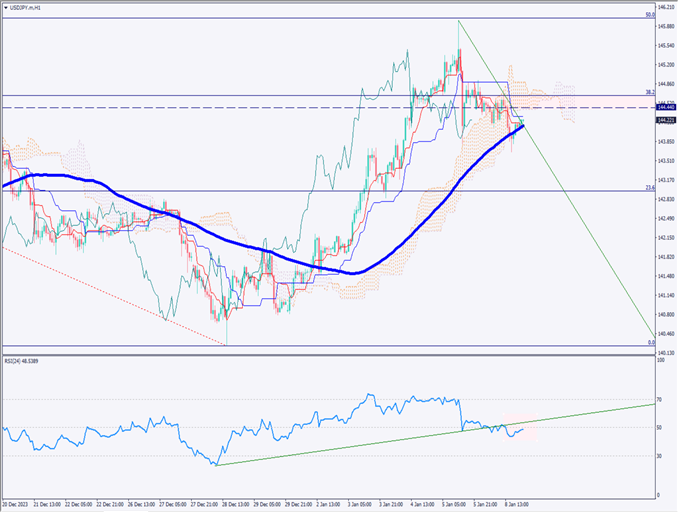
Analysis of the 1-hour chart for USD/JPY. The 90 moving average is acting as a support line, and breaking below this line could lead to a significant drop. The RSI is at 47, indicating a downward trend. Considering currency strength, the USD is slightly dominant, and the market could temporarily retrace to around 144.40 JPY.

The range from 144.44 to 144.65 JPY forms a significant resistance zone, with the Ichimoku cloud also nearby, likely to be strongly acknowledged by market participants.

The day trading strategy is to aim for selling on the rebound, with a sell entry at 144.44 JPY, take profit at 143.50 JPY, and stop loss at 144.89 JPY.

Support and Resistance Lines

Upcoming resistance lines to consider:

144.40 JPY – Major resistance line

[USDJPY/ H1]

Market Sentiment

USDJPY: Sell: 61%, Buy: 39%

Today’s Important Economic Indicators

Economic Indicators and EventsJST (Japan Standard Time)
Tokyo Core Consumer Price Index8:30
Australian Retail Sales9:30
Canadian Building Permits22:30

*Trading advice in this article is not provided by Milton Markets, but by Shu Fujiyasu Jr., a certified technical analyst.

Ready to trade?

Open live account

Related Analysis

USD/JPY Forms a Range — What’s Next?

USD/JPY Forms a Range — What’s Next?

TodayRead more →
USD/JPY: Selling Pressure Dominates on Rallies

USD/JPY: Selling Pressure Dominates on Rallies

7 days agoRead more →
USD/JPY dips slightly on LDP landslide victory

USD/JPY dips slightly on LDP landslide victory

7 days agoRead more →

This material is for informational purposes only and does not constitute investment advice. Trading leveraged products involves significant risk of loss. Past performance is not indicative of future results.

Share

X

Start trading today

  • Fast execution
  • Competitive spreads
  • 24/7 support
Open live accountView account types
Milton Markets
Twitter/XYouTube

Markets

FOREX
CRYPTO
COMMODITIES
INDICES
STOCKS

Trading

  • Flex Account
  • Smart Account
  • Elite Account
  • MetaTrader 5 (MT5)
  • MetaTrader 4 (MT4)
  • Launch WebTrader
  • Learn Hub
  • Economic Calendar
  • Promotions

Company

  • About Us
  • NDD Technology
  • Customer Protection
  • Execution Conditions
  • Company News
  • Blog
  • Market Analysis

Partners

  • IB Program
  • PAMM Program
  • White Label
  • Investor Login
  • Manager Login

Support

  • Terms of Service
  • Privacy Policy
  • Risk Disclosure
  • Contact Us
  • Help Center
  • My Page Login
Milton Markets is a trading name of Milton Markets Ltd. Milton Markets Ltd. is part of Milton Global and is registered in Saint Lucia (Registration Number: 2023-00166). As part of Milton Global, we adhere to the same high regulatory standards as Milton Global Ltd, which is regulated by the Seychelles Financial Services Authority (FSA) under license SD040.
Risk Warning: CFD trading carries high risk and may not suit all investors. You may lose more than your initial investment. Ensure you understand the risks before trading.
Restrictions: Milton Markets does not provide services to the following countries (not limited to these): United States, Canada, European Union countries, Iran, North Korea, Saint Vincent and the Grenadines, Afghanistan, American Samoa, Belarus, Russia, Burundi, Central African Republic, Congo (Brazzaville), Cuba, Iraq, Lebanon, Liberia, Libya, Myanmar, Puerto Rico, Rwanda, Somalia, Sudan, Syria, US Virgin Islands, Venezuela, Yemen, Zimbabwe, Côte d'Ivoire, Mali, Guinea, Eritrea.
You must be 18 years old or the legal age in your country of residence.
By opening an account, you are considered to have registered of your own volition without solicitation from Milton Markets.
Disclaimer: This website does not constitute investment advice. Content should not be construed as personal advice. Seek independent financial advice.
© 2026 Milton Markets. All rights reserved.
TermsPrivacyCookiesRisk