Milton Markets
Markets
Trading
Company
Partners
Sign InOpen Account
  1. Home/
  2. Market Analysis/
  3. USD/JPY Nears 145 JPY, U.S. Inflation Rate Exceeds Expectations and Accelerates【January 12, 2024】
Koki Ando•Jan 12, 2024

USD/JPY Nears 145 JPY, U.S. Inflation Rate Exceeds Expectations and Accelerates【January 12, 2024】

Koki Ando headshot

Daily Market Analysis

Koki AndoChief Market Analyst

Expert analysis of today's market movements and trading opportunities

Koki Ando headshot

Daily Market Analysis

Koki AndoChief Market Analyst

Expert analysis of today's market movements and trading opportunities

Fundamental Analysis

  • U.S. CPI exceeds market expectations, indicating accelerated inflation.
  • Expectations for a U.S. rate cut recede; a March rate cut seems challenging.
  • USD/JPY rises, but momentum slows in the latter part of NY trading hours.

USDJPY Technical Analysis

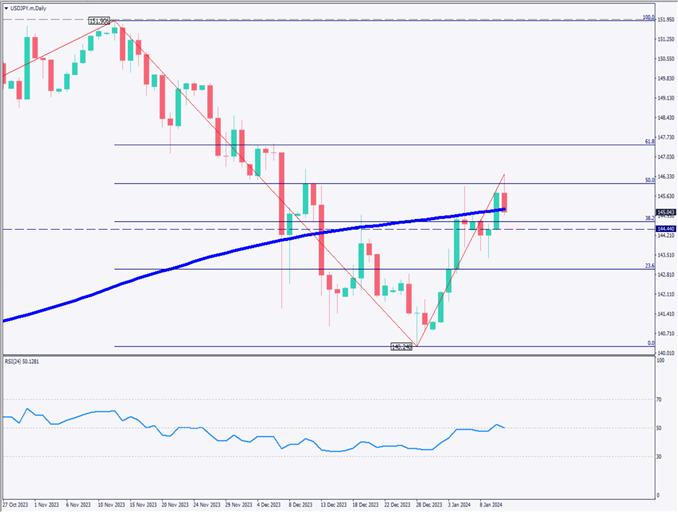
Analysis of USD/JPY’s daily chart. After breaking above the 200-day moving average, it fell post-CPI announcement but this average is acting as a support line. Support levels are at 144.50 JPY, the 38.2% Fibonacci line, and the 200-day moving average. Resistance is seen at the 50% Fibonacci retracement line.
The current situation is at a crossroads, deciding whether it is forming a recovery high or continuing an upward trend. RSI is hovering around 50%, indicating unclear market direction. The focus now is on whether the 50% Fibonacci retracement line will be retested and surpassed.

[USDJPY/ D1]

Day Trading Strategy (1-Hour Chart)

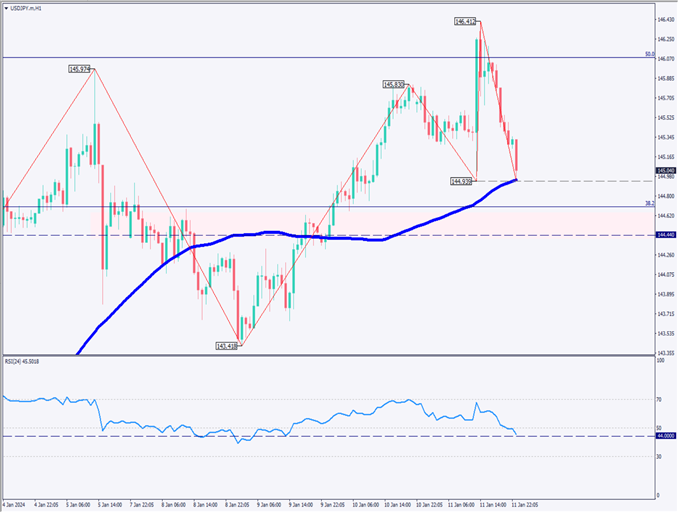
Analysis of the USD/JPY 1-hour chart. The 90 moving average line acts as a support, with the price rising to 146.40 JPY post-CPI announcement before slowing down. Falling below this moving average line could lead to further decline.
RSI is below 50, at 46, indicating a downtrend. No significant growth is seen after hitting a high, suggesting a potential pullback. The 200-day moving average on the daily chart is around 146.18 JPY; falling below this could lead to further declines. However, it’s too early to adopt a selling strategy.
The day trading strategy is to buy on dips, with a buy entry at 144.55 JPY, a take-profit at 145.30 JPY, and a stop-loss at 144.20 JPY.

Support and Resistance Lines

Upcoming significant support and resistance lines:

144.70 JPY: 38.2% Fibonacci line on the daily chart.
144.44 JPY: Support line on the monthly chart.

[USDJPY/ H1]

Market Sentiment

USDJPY Sell: 57%, Buy: 43%

Today’s Important Economic Indicators

Economic Indicators and EventsJST (Japan Standard Time)
UK Gross Domestic Product (GDP)16:00
U.S. Producer Price Index22:30

*Trading advice in this article is not provided by Milton Markets, but by Shu Fujiyasu Jr., a certified technical analyst.

Ready to trade?

Open live account

Related Analysis

Gold Remains in a Downtrend, $5,000 Acts as Strong Resistance

Gold Remains in a Downtrend, $5,000 Acts as Strong Resistance

TodayRead more →
USD/JPY Forms a Range — What’s Next?

USD/JPY Forms a Range — What’s Next?

TodayRead more →
USD/JPY dips slightly on LDP landslide victory

USD/JPY dips slightly on LDP landslide victory

7 days agoRead more →

This material is for informational purposes only and does not constitute investment advice. Trading leveraged products involves significant risk of loss. Past performance is not indicative of future results.

Share

X

Start trading today

  • Fast execution
  • Competitive spreads
  • 24/7 support
Open live accountView account types
Milton Markets
Twitter/XYouTube

Markets

FOREX
CRYPTO
COMMODITIES
INDICES
STOCKS

Trading

  • Flex Account
  • Smart Account
  • Elite Account
  • MetaTrader 5 (MT5)
  • MetaTrader 4 (MT4)
  • Launch WebTrader
  • Learn Hub
  • Economic Calendar
  • Promotions

Company

  • About Us
  • NDD Technology
  • Customer Protection
  • Execution Conditions
  • Company News
  • Blog
  • Market Analysis

Partners

  • IB Program
  • PAMM Program
  • White Label
  • Investor Login
  • Manager Login

Support

  • Terms of Service
  • Privacy Policy
  • Risk Disclosure
  • Contact Us
  • Help Center
  • My Page Login
Milton Markets is a trading name of Milton Markets Ltd. Milton Markets Ltd. is part of Milton Global and is registered in Saint Lucia (Registration Number: 2023-00166). As part of Milton Global, we adhere to the same high regulatory standards as Milton Global Ltd, which is regulated by the Seychelles Financial Services Authority (FSA) under license SD040.
Risk Warning: CFD trading carries high risk and may not suit all investors. You may lose more than your initial investment. Ensure you understand the risks before trading.
Restrictions: Milton Markets does not provide services to the following countries (not limited to these): United States, Canada, European Union countries, Iran, North Korea, Saint Vincent and the Grenadines, Afghanistan, American Samoa, Belarus, Russia, Burundi, Central African Republic, Congo (Brazzaville), Cuba, Iraq, Lebanon, Liberia, Libya, Myanmar, Puerto Rico, Rwanda, Somalia, Sudan, Syria, US Virgin Islands, Venezuela, Yemen, Zimbabwe, Côte d'Ivoire, Mali, Guinea, Eritrea.
You must be 18 years old or the legal age in your country of residence.
By opening an account, you are considered to have registered of your own volition without solicitation from Milton Markets.
Disclaimer: This website does not constitute investment advice. Content should not be construed as personal advice. Seek independent financial advice.
© 2026 Milton Markets. All rights reserved.
TermsPrivacyCookiesRisk