Milton Markets
Markets
Trading
Company
Partners
Sign InOpen Account
  1. Home/
  2. Market Analysis/
  3. USD/JPY Falls Ahead of Key Indicators, Possibly Due to Position Adjustments【January 30, 2024】
Koki Ando•Jan 30, 2024

USD/JPY Falls Ahead of Key Indicators, Possibly Due to Position Adjustments【January 30, 2024】

Koki Ando headshot

Daily Market Analysis

Koki AndoChief Market Analyst

Expert analysis of today's market movements and trading opportunities

Koki Ando headshot

Daily Market Analysis

Koki AndoChief Market Analyst

Expert analysis of today's market movements and trading opportunities

Fundamental Analysis

  • Difficult market conditions for a rise ahead of key indicators such as FOMC and GDP from various countries
  • USD/JPY fails to break the resistance zone at 148.12 JPY, forming a consolidation over two weeks
  • USD/JPY breaks the upward trend line, influenced by a weaker dollar

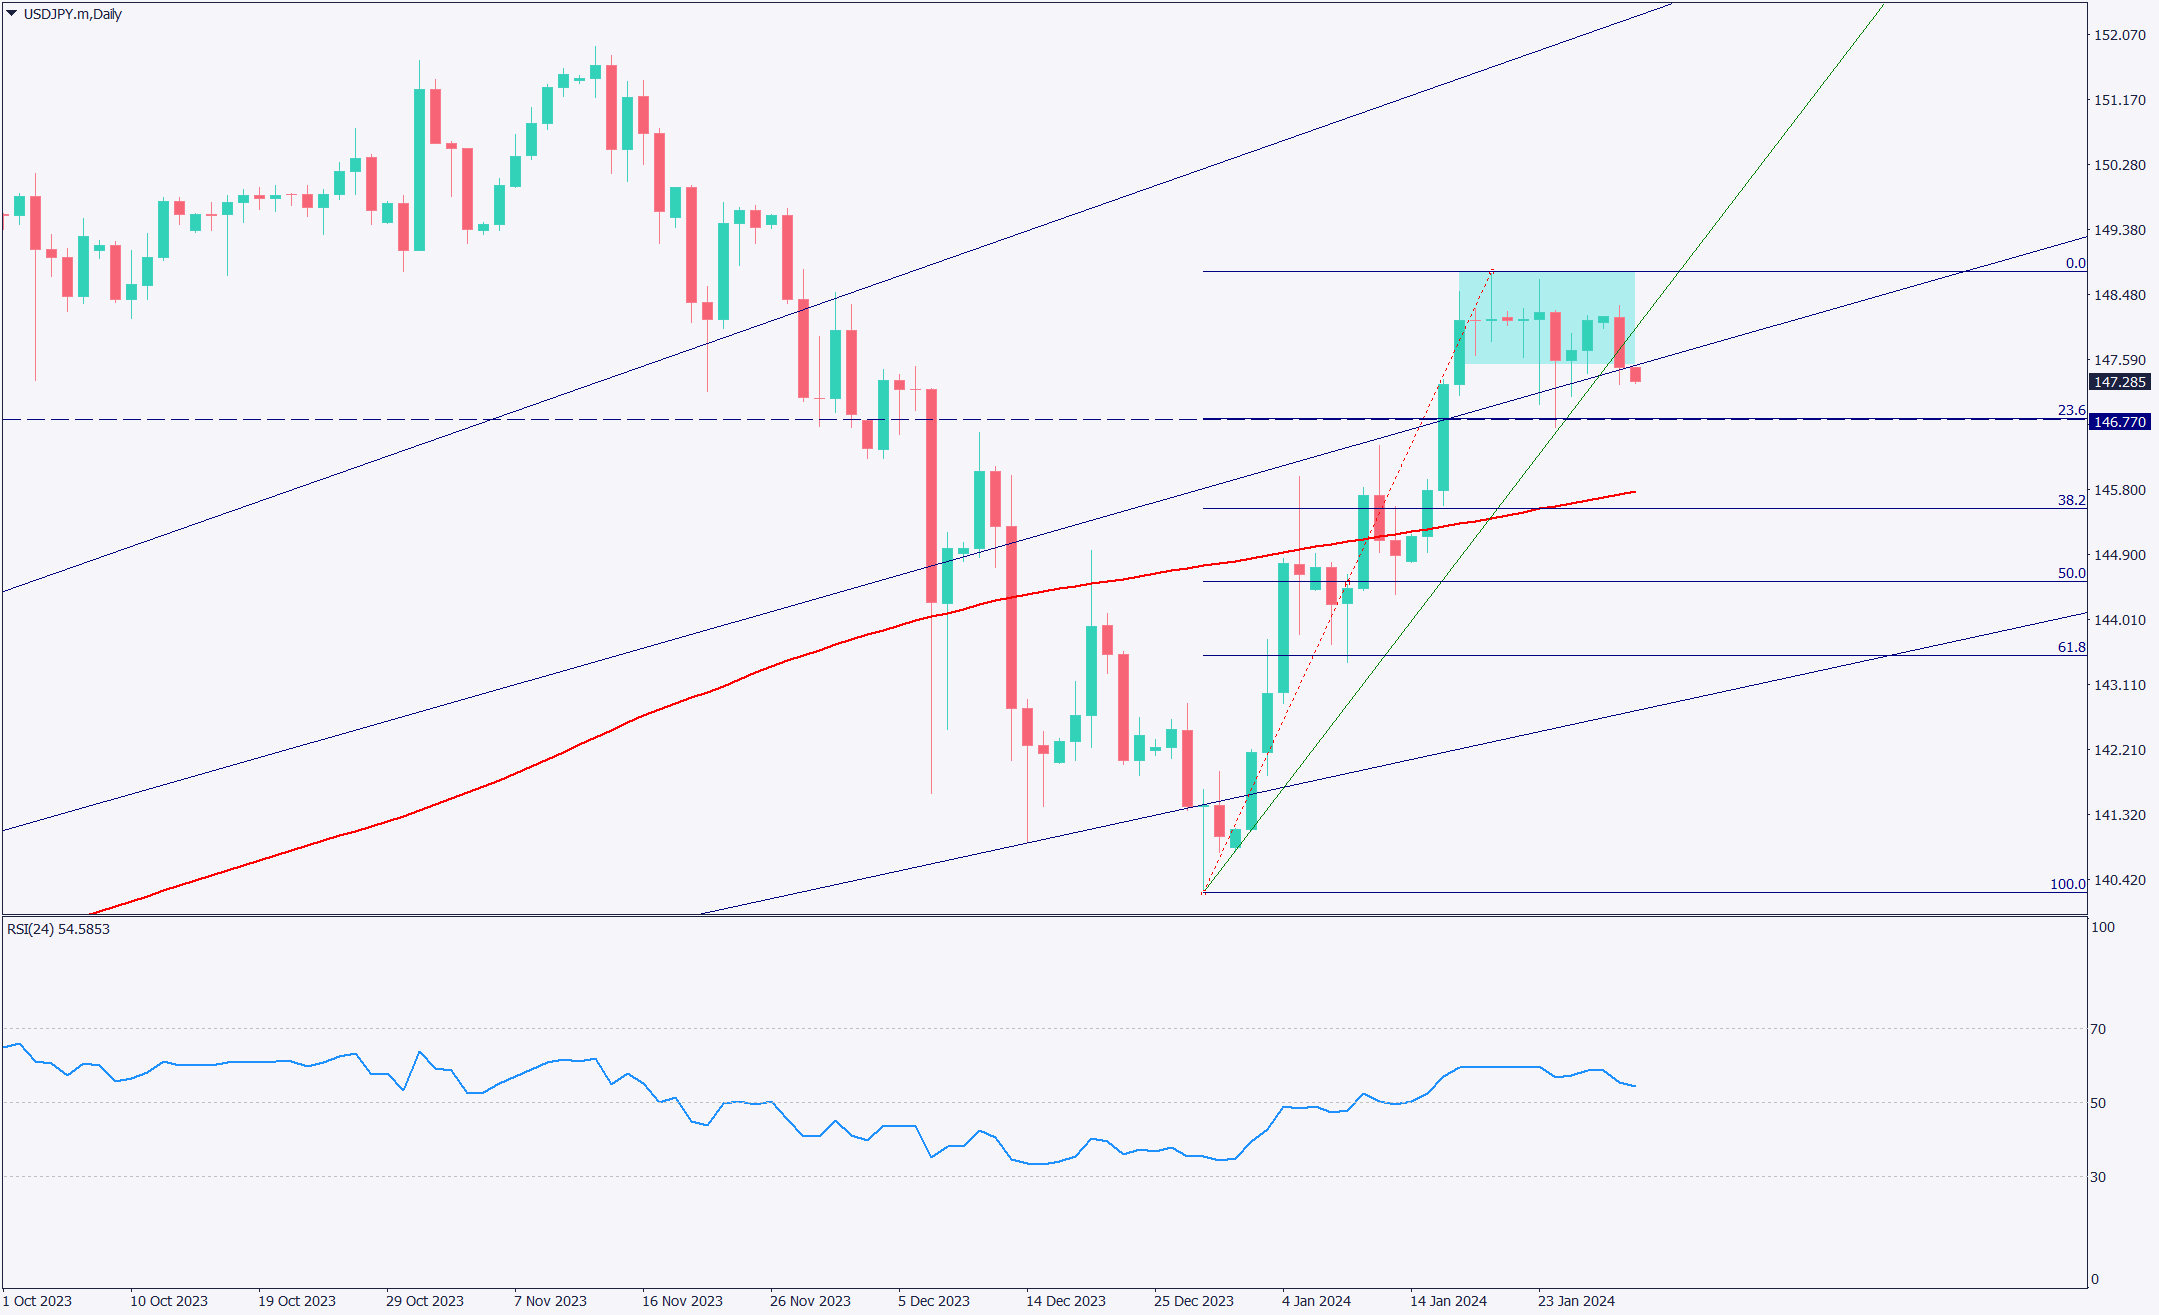
USDJPY Technical Analysis

Analyzing the daily chart of USD/JPY. USD/JPY has broken out downwards from the Fibonacci fan. Analyzing the Dollar Index indicates a weaker dollar trend, leading to a market prone to downward pressure on USD/JPY.

USD/JPY tried the 148.12 JPY resistance line over two weeks but did not show an aggressive rise due to fundamentals like the Bank of Japan’s potential rate hike and global shifts towards rate cuts.

A downward move towards the recent support line at 146.77 JPY is conceivable. Today’s focus will also be on important economic indicators from Europe.

[USDJPY/ D1]

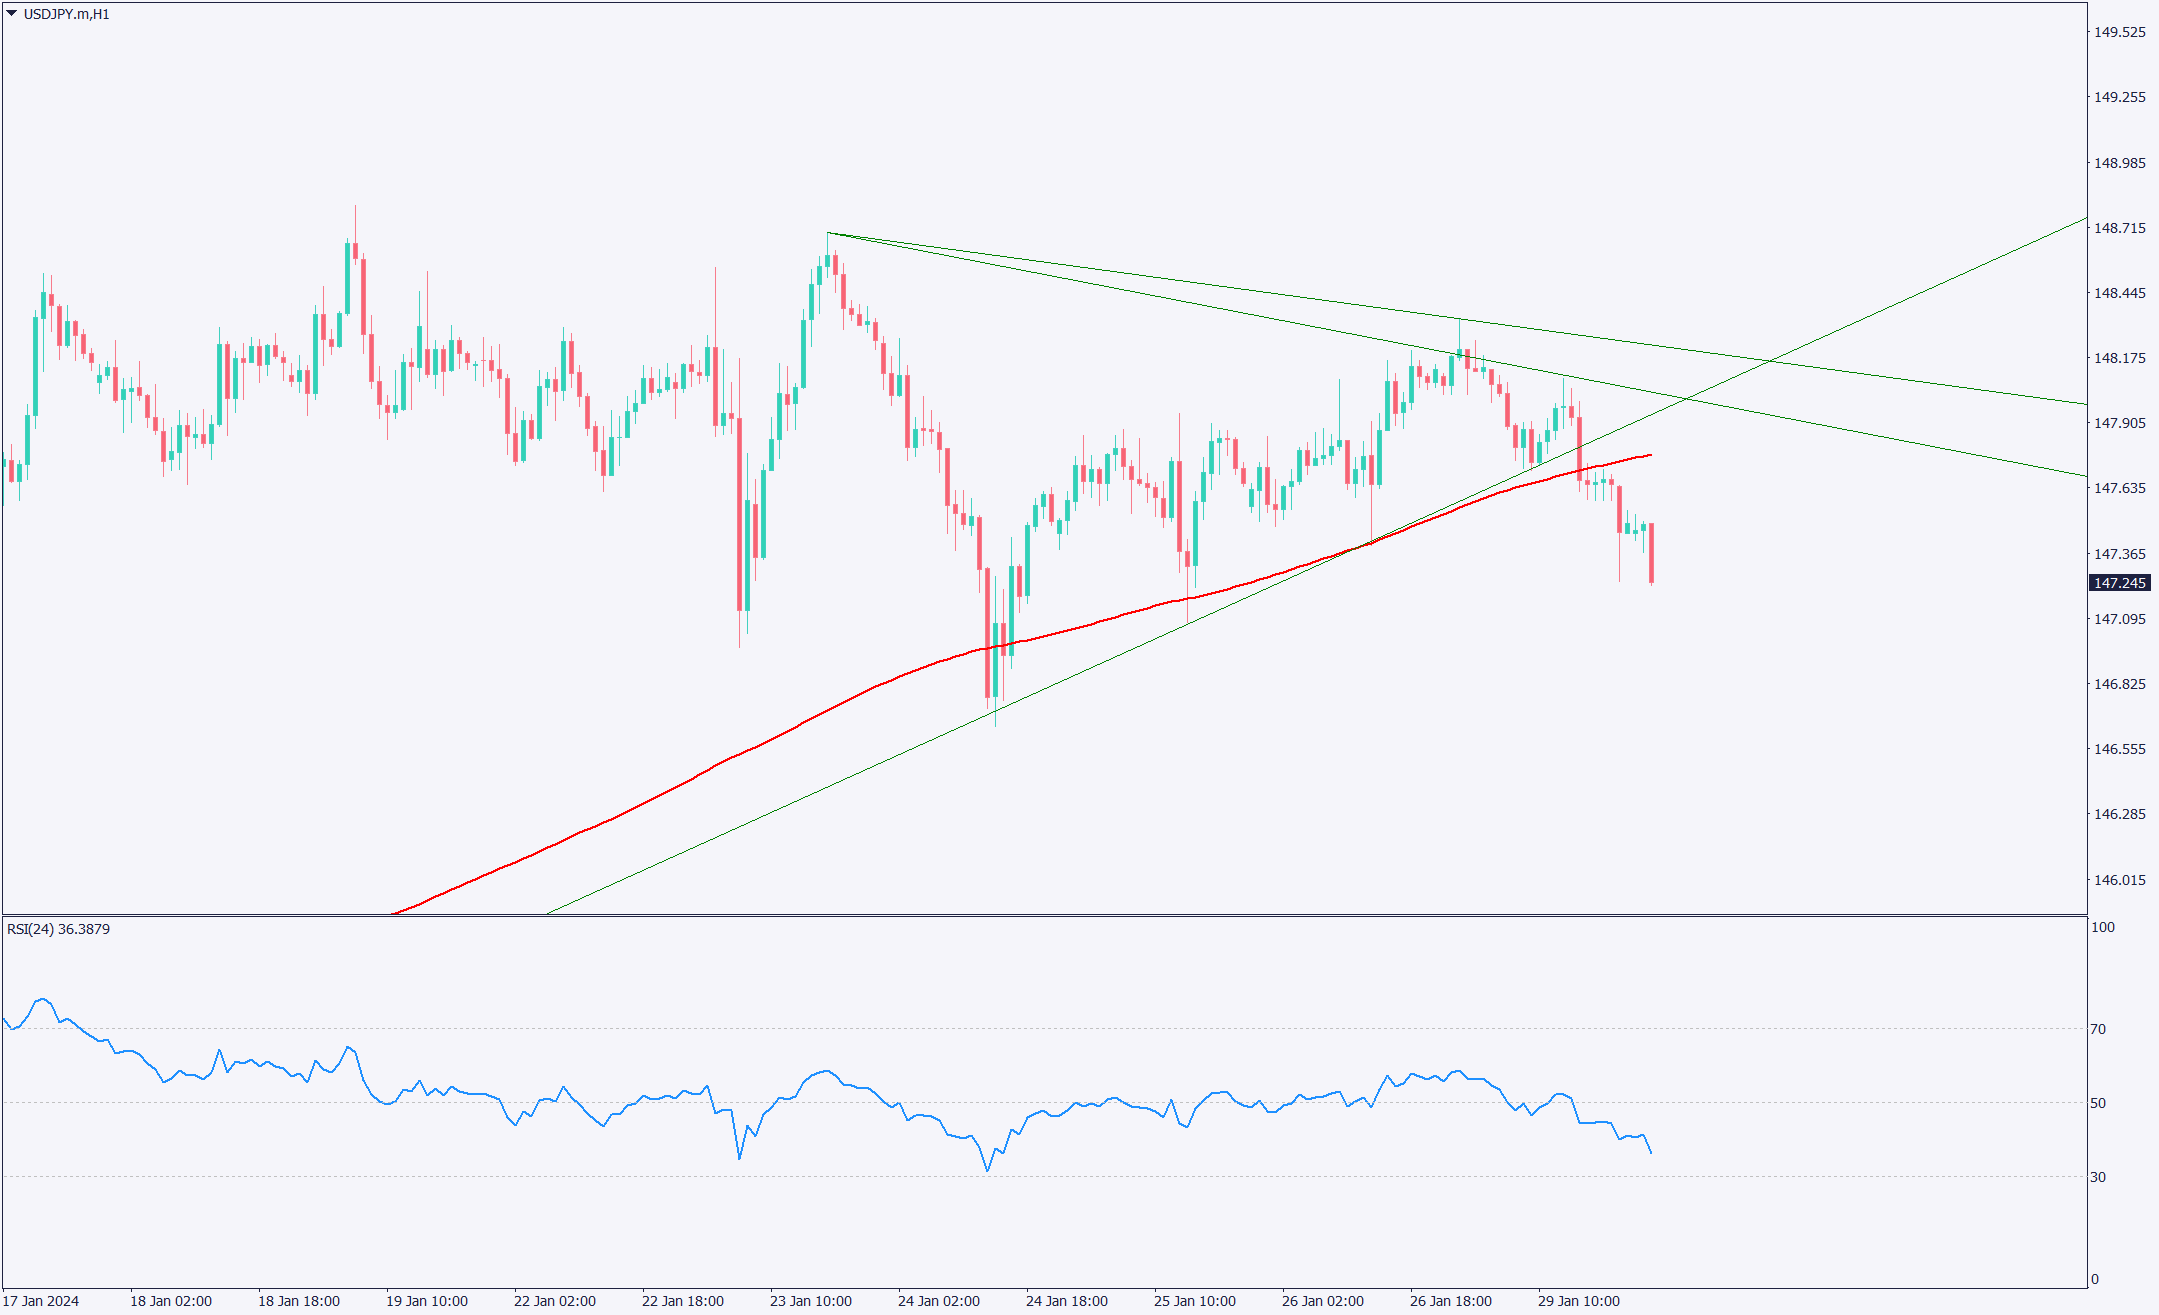
Day Trading Strategy (1-Hour Chart)

Analyzing the 1-hour chart of USD/JPY. The chart shows a downtrend with lower highs, confirmed by the trend line. It also shows a breakout downwards from an important upward trend line. With a weaker dollar, there is a relative increase in yen buying.

After forming a range for two weeks at high levels, a breakout downwards could lead to significant movement. The aim is to sell down to 146.77 JPY, the 23.6% Fibonacci retracement level on the daily chart.

With the FOMC ahead from tomorrow, the market is unlikely to rise aggressively. The RSI is at 37, indicating a stable downward trend. Day trading strategy: sell. Sell entries in the early 147 JPY range, rotate sales down to 146.77 JPY, and stop if the upward trend line is surpassed.

Support and Resistance Lines

Upcoming significant support and resistance lines:

146.77 JPY… A major support line

[USDJPY/ H1]

Market Sentiment

USDJPY Sell: 66%, Buy: 34%

Today’s Important Economic Indicators

Economic Indicators and EventsJST (Japan Standard Time)
Australian Retail Sales9:30
German GDP18:00
EU Gross Domestic Product19:00
U.S. Consumer Confidence IndexMidnight

*Trading advice in this article is not provided by Milton Markets, but by Shu Fujiyasu Jr., a certified technical analyst.

Ready to trade?

Open live account

Related Analysis

Gold and Silver Continue to Hit Record Highs

Gold and Silver Continue to Hit Record Highs

19 days agoRead more →
USD/JPY dips slightly on LDP landslide victory

USD/JPY dips slightly on LDP landslide victory

7 days agoRead more →
Can Gold Renew Its Record High?

Can Gold Renew Its Record High?

10 days agoRead more →

This material is for informational purposes only and does not constitute investment advice. Trading leveraged products involves significant risk of loss. Past performance is not indicative of future results.

Share

X

Start trading today

  • Fast execution
  • Competitive spreads
  • 24/7 support
Open live accountView account types
Milton Markets
Twitter/XYouTube

Markets

FOREX
CRYPTO
COMMODITIES
INDICES
STOCKS

Trading

  • Flex Account
  • Smart Account
  • Elite Account
  • MetaTrader 5 (MT5)
  • MetaTrader 4 (MT4)
  • Launch WebTrader
  • Learn Hub
  • Economic Calendar
  • Promotions

Company

  • About Us
  • NDD Technology
  • Customer Protection
  • Execution Conditions
  • Company News
  • Blog
  • Market Analysis

Partners

  • IB Program
  • PAMM Program
  • White Label
  • Investor Login
  • Manager Login

Support

  • Terms of Service
  • Privacy Policy
  • Risk Disclosure
  • Contact Us
  • Help Center
  • My Page Login
Milton Markets is a trading name of Milton Markets Ltd. Milton Markets Ltd. is part of Milton Global and is registered in Saint Lucia (Registration Number: 2023-00166). As part of Milton Global, we adhere to the same high regulatory standards as Milton Global Ltd, which is regulated by the Seychelles Financial Services Authority (FSA) under license SD040.
Risk Warning: CFD trading carries high risk and may not suit all investors. You may lose more than your initial investment. Ensure you understand the risks before trading.
Restrictions: Milton Markets does not provide services to the following countries (not limited to these): United States, Canada, European Union countries, Iran, North Korea, Saint Vincent and the Grenadines, Afghanistan, American Samoa, Belarus, Russia, Burundi, Central African Republic, Congo (Brazzaville), Cuba, Iraq, Lebanon, Liberia, Libya, Myanmar, Puerto Rico, Rwanda, Somalia, Sudan, Syria, US Virgin Islands, Venezuela, Yemen, Zimbabwe, Côte d'Ivoire, Mali, Guinea, Eritrea.
You must be 18 years old or the legal age in your country of residence.
By opening an account, you are considered to have registered of your own volition without solicitation from Milton Markets.
Disclaimer: This website does not constitute investment advice. Content should not be construed as personal advice. Seek independent financial advice.
© 2026 Milton Markets. All rights reserved.
TermsPrivacyCookiesRisk