Milton Markets
Markets
Trading
Company
Partners
Sign InOpen Account
  1. Home/
  2. Market Analysis/
  3. EUR/USD Falls, US CPI Surprise Puts Year-End Rate Cut in Doubt?【February 14, 2024】
Koki Ando•Feb 14, 2024

EUR/USD Falls, US CPI Surprise Puts Year-End Rate Cut in Doubt?【February 14, 2024】

Koki Ando headshot

Daily Market Analysis

Koki AndoChief Market Analyst

Expert analysis of today's market movements and trading opportunities

Koki Ando headshot

Daily Market Analysis

Koki AndoChief Market Analyst

Expert analysis of today's market movements and trading opportunities

Fundamental Analysis

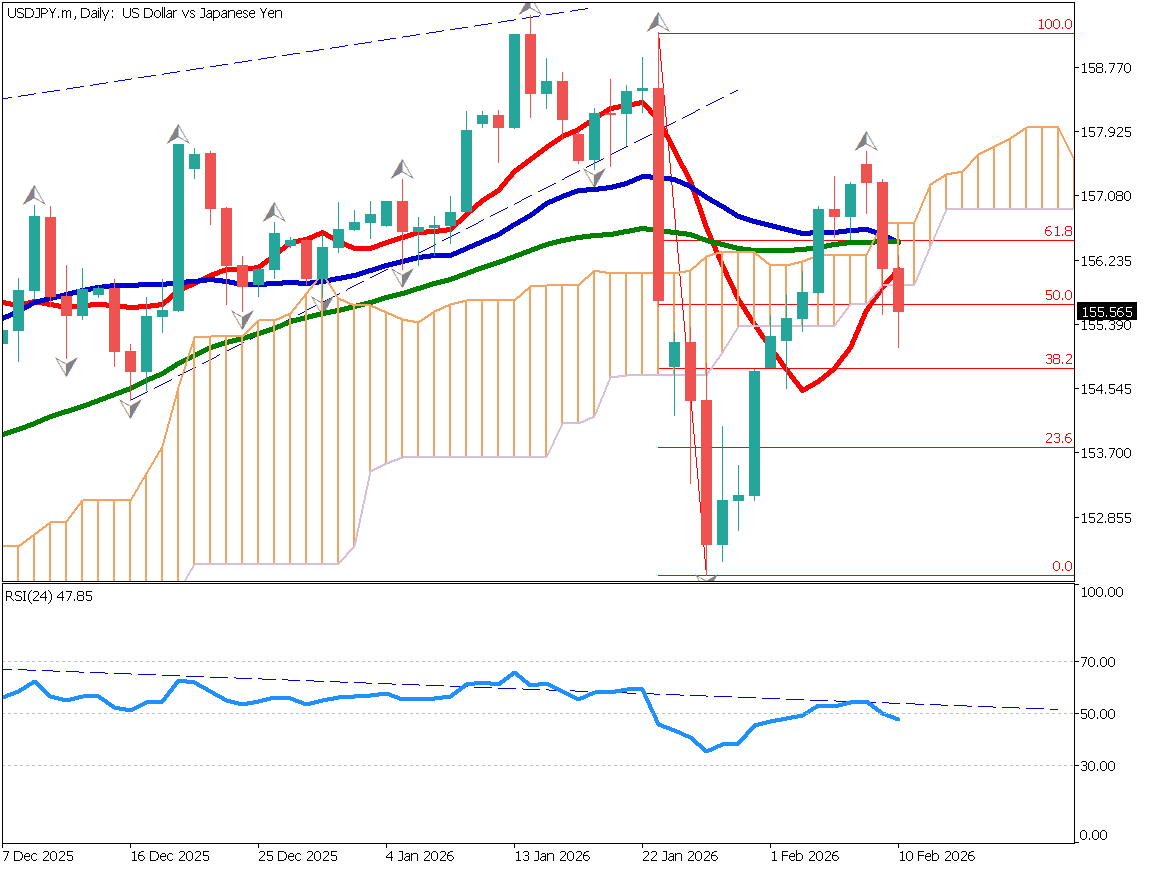
  • US CPI exceeds expectations, USD/JPY surges to 150.88 JPY momentarily.
  • Speculation for a US rate cut recedes, with the probability of a May rate cut dropping to 32%.
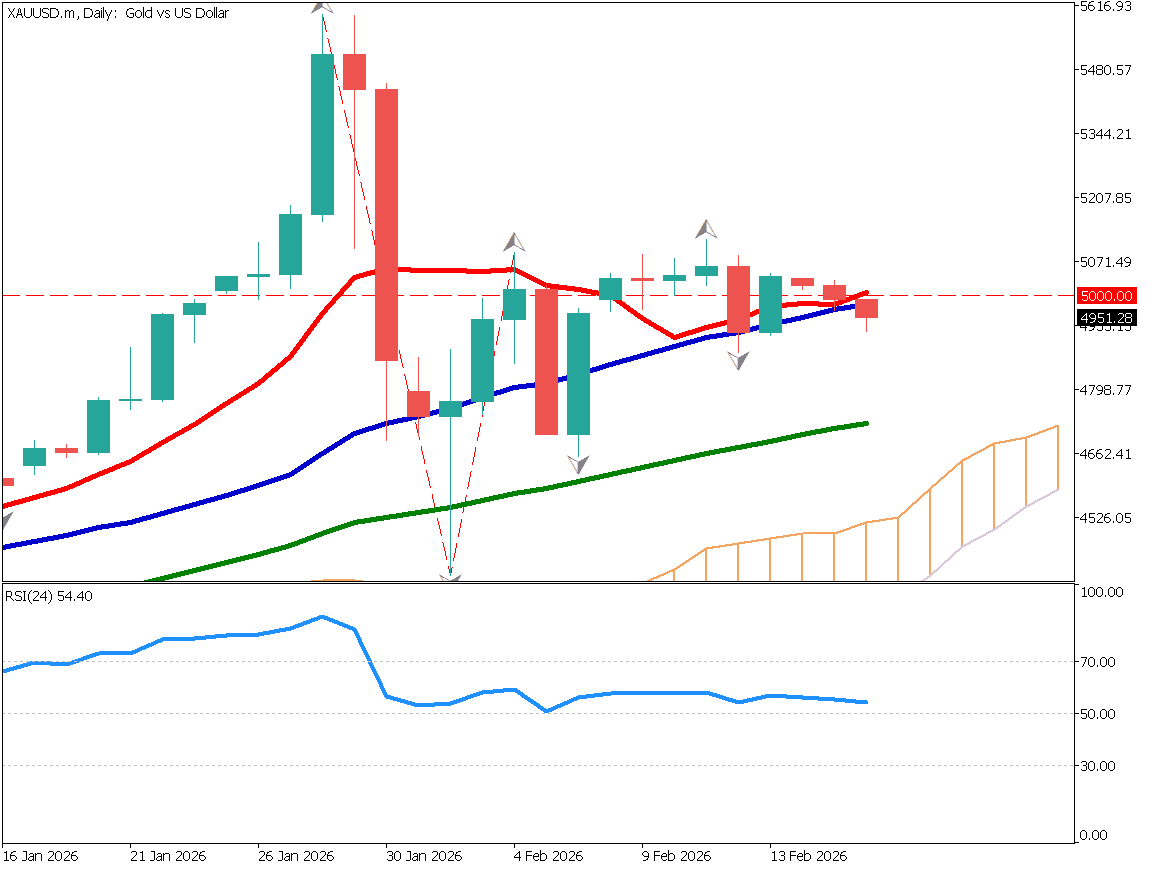
  • Gold plummets, falling below 2000 USD to trade at 1992 USD.

EURUSD Technical Analysis

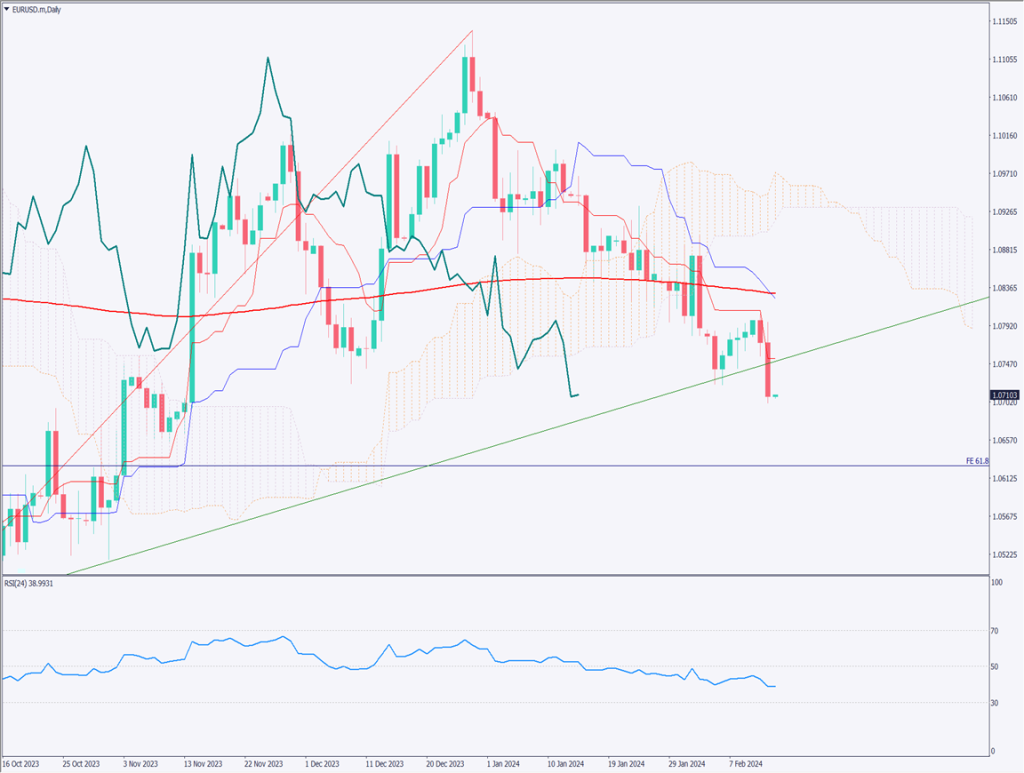
Analyzing the daily chart of EUR/USD, the pair has updated its recent lows to around 1.0710 USD due to a sharp appreciation of the dollar. The US CPI exceeded expectations, with the core CPI rising for the first time in eight months. At 3.1%, it disappointed the market, which had hoped for a figure in the 2% range, rapidly retracting rate cut speculation.
The Eurozone has contained inflation, with ECB officials hinting at a rate cut within the year. However, in the US, the failure to contain inflation casts doubt on any rate cuts within the year.

In an environment conducive to a stronger dollar, EUR/USD has fallen. It broke out below an upward trend line. Drawing Fibonacci expansion shows a target downside price of 1.0629 USD. The RSI is at 40, indicating a stable downward trend, suggesting there is still room for decline.

[EURUSD/ D1]

Day Trading Strategy (1-Hour Chart)

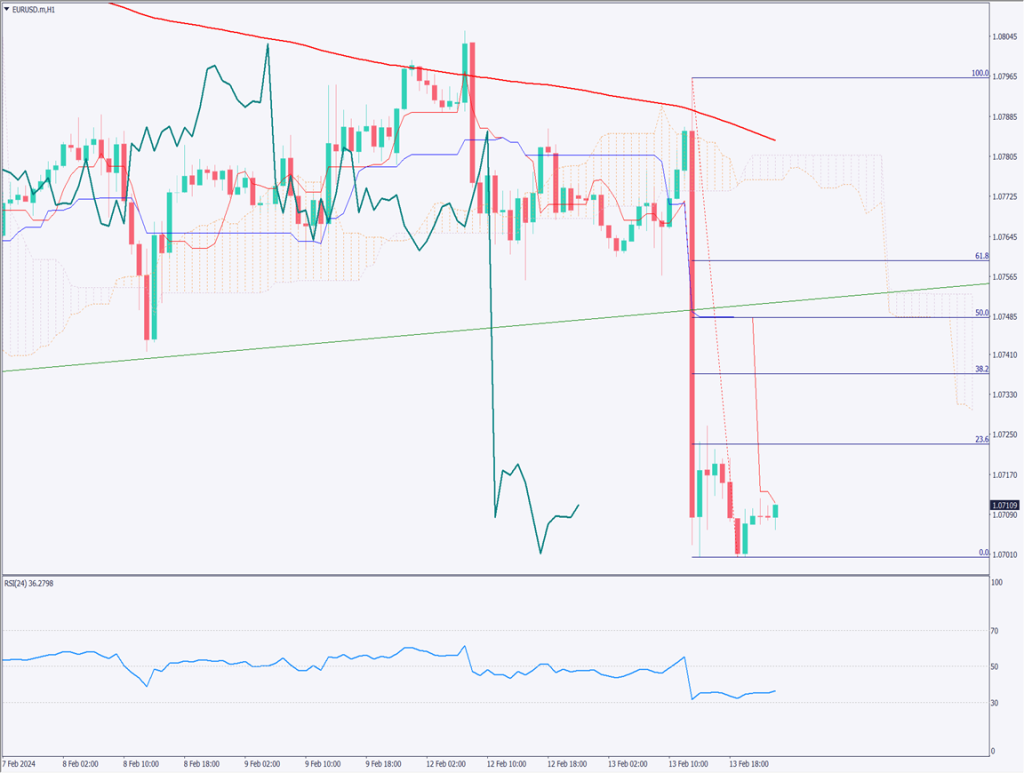
Analyzing the 1-hour chart of EUR/USD, a sharp decline has made it difficult to test lower than 1.07 USD. A short-term rise is expected. Drawing Fibonacci retracement from the high to low of yesterday’s large bearish candle suggests a rebound to around 1.0738 USD, corresponding to the 38.2% level, and possibly up to 1.0750 USD at the 50% level, where the Ichimoku Kinko Hyo baseline is currently situated.
Today’s day trading strategy is to sell on the rebound. Entry at 1.0738 USD, target at 1.0675 USD, and stop at 1.0775 USD.

As the RSI on the 1-hour chart approaches around 50, it sets the stage for a sell on the rebound. In this sense, it’s also important to keep an eye on the RSI value.

Support and Resistance Lines

Upcoming significant support and resistance lines:

1.0676 USD: Major support line
1.0628 USD: 61.8% Fibonacci level

[EURUSD/ H1]

Market Sentiment

EURUSD Sell: 39% Buy: 61%

Today’s important economic indicators

Economic indicators and eventsJapan time
UK Consumer Price Index16:00
EU Gross Domestic Product19:00
US Crude Oil Inventories0:30 the following day

*Trading advice in this article is not provided by Milton Markets, but by Shu Fujiyasu Jr., a certified technical analyst.

Ready to trade?

Open live account

Related Analysis

Gold Remains in a Downtrend, $5,000 Acts as Strong Resistance

Gold Remains in a Downtrend, $5,000 Acts as Strong Resistance

TodayRead more →
USD/JPY Forms a Range — What’s Next?

USD/JPY Forms a Range — What’s Next?

TodayRead more →
USD/JPY: Selling Pressure Dominates on Rallies

USD/JPY: Selling Pressure Dominates on Rallies

6 days agoRead more →

This material is for informational purposes only and does not constitute investment advice. Trading leveraged products involves significant risk of loss. Past performance is not indicative of future results.

Share

X

Start trading today

  • Fast execution
  • Competitive spreads
  • 24/7 support
Open live accountView account types
Milton Markets
Twitter/XYouTube

Markets

FOREX
CRYPTO
COMMODITIES
INDICES
STOCKS

Trading

  • Flex Account
  • Smart Account
  • Elite Account
  • MetaTrader 5 (MT5)
  • MetaTrader 4 (MT4)
  • Launch WebTrader
  • Learn Hub
  • Economic Calendar
  • Promotions

Company

  • About Us
  • NDD Technology
  • Customer Protection
  • Execution Conditions
  • Company News
  • Blog
  • Market Analysis

Partners

  • IB Program
  • PAMM Program
  • White Label
  • Investor Login
  • Manager Login

Support

  • Terms of Service
  • Privacy Policy
  • Risk Disclosure
  • Contact Us
  • Help Center
  • My Page Login
Milton Markets is a trading name of Milton Markets Ltd. Milton Markets Ltd. is part of Milton Global and is registered in Saint Lucia (Registration Number: 2023-00166). As part of Milton Global, we adhere to the same high regulatory standards as Milton Global Ltd, which is regulated by the Seychelles Financial Services Authority (FSA) under license SD040.
Risk Warning: CFD trading carries high risk and may not suit all investors. You may lose more than your initial investment. Ensure you understand the risks before trading.
Restrictions: Milton Markets does not provide services to the following countries (not limited to these): United States, Canada, European Union countries, Iran, North Korea, Saint Vincent and the Grenadines, Afghanistan, American Samoa, Belarus, Russia, Burundi, Central African Republic, Congo (Brazzaville), Cuba, Iraq, Lebanon, Liberia, Libya, Myanmar, Puerto Rico, Rwanda, Somalia, Sudan, Syria, US Virgin Islands, Venezuela, Yemen, Zimbabwe, Côte d'Ivoire, Mali, Guinea, Eritrea.
You must be 18 years old or the legal age in your country of residence.
By opening an account, you are considered to have registered of your own volition without solicitation from Milton Markets.
Disclaimer: This website does not constitute investment advice. Content should not be construed as personal advice. Seek independent financial advice.
© 2026 Milton Markets. All rights reserved.
TermsPrivacyCookiesRisk