Milton Markets
Markets
Trading
Company
Partners
Sign InOpen Account
  1. Home/
  2. Market Analysis/
  3. Eurodollar Trends Upward, Faces Resistance at 200-Day Moving Average【February 21, 2024】
Koki Ando•Feb 21, 2024

Eurodollar Trends Upward, Faces Resistance at 200-Day Moving Average【February 21, 2024】

Koki Ando headshot

Daily Market Analysis

Koki AndoChief Market Analyst

Expert analysis of today's market movements and trading opportunities

Koki Ando headshot

Daily Market Analysis

Koki AndoChief Market Analyst

Expert analysis of today's market movements and trading opportunities

Fundamental Analysis

  • The discussion of potential U.S. interest rate hikes surfaces again as the fight against inflation appears incomplete.
  • The market’s gaze turns towards the detailed minutes of the Federal Open Market Committee (FOMC) due early tomorrow, with several speeches from the Federal Reserve officials in line.
  • The atmosphere of caution mounts as the financial world anticipates the disclosures from Nvidia, an entity known to have buoyed stock prices.

EURUSD Technical Analysis

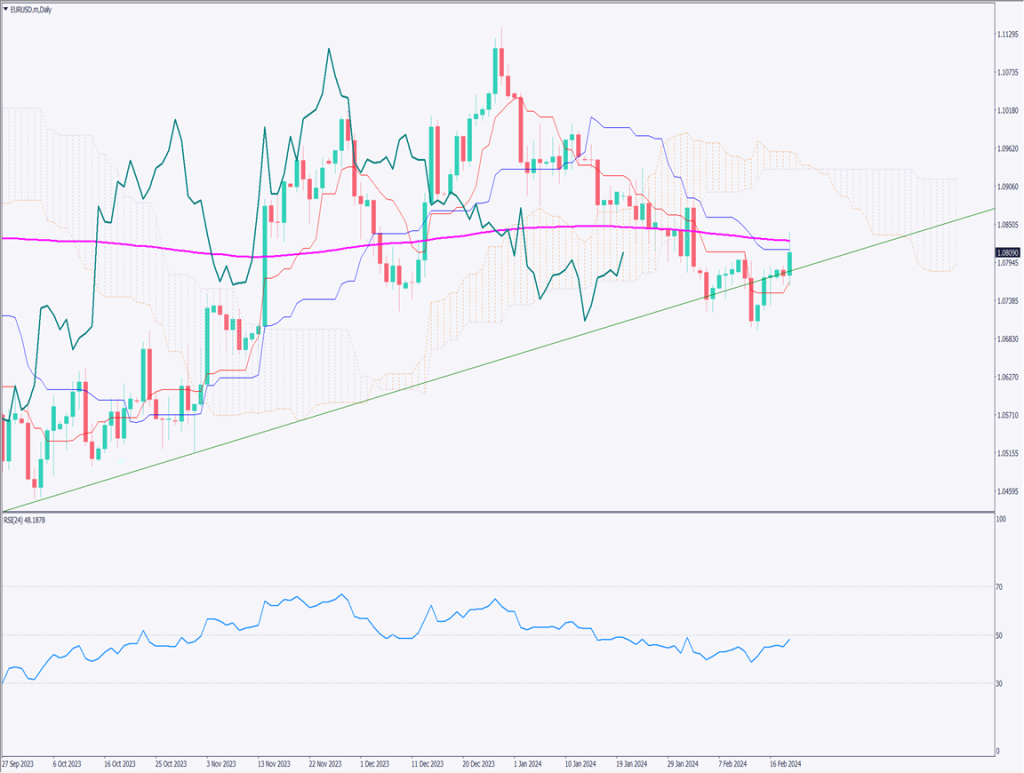
Studying the daily chart for the Eurodollar, the trend has been rampantly bullish, notably moving above the Ichimoku’s Base Line. Recent market performance saw it breaching the Kijun Sen (Base Line) yesterday, but it met a substantial level of resistance, grounding it to about 1.0810USD.

Whilst the circadian price development led to the belief of a down-trending segue due to an ejected uptrend, the token currency rather faced a pullback. The RSI curtails at 48, signifying the demand to recognize the risk of a bounce. As minutes from the U.S. FOMC become ready for early divulgement tomorrow, Eurodollar’s match may see clear high tides fluctuation.

[EURUSD/ D1]

Day Trading Strategy (1-Hour Chart)

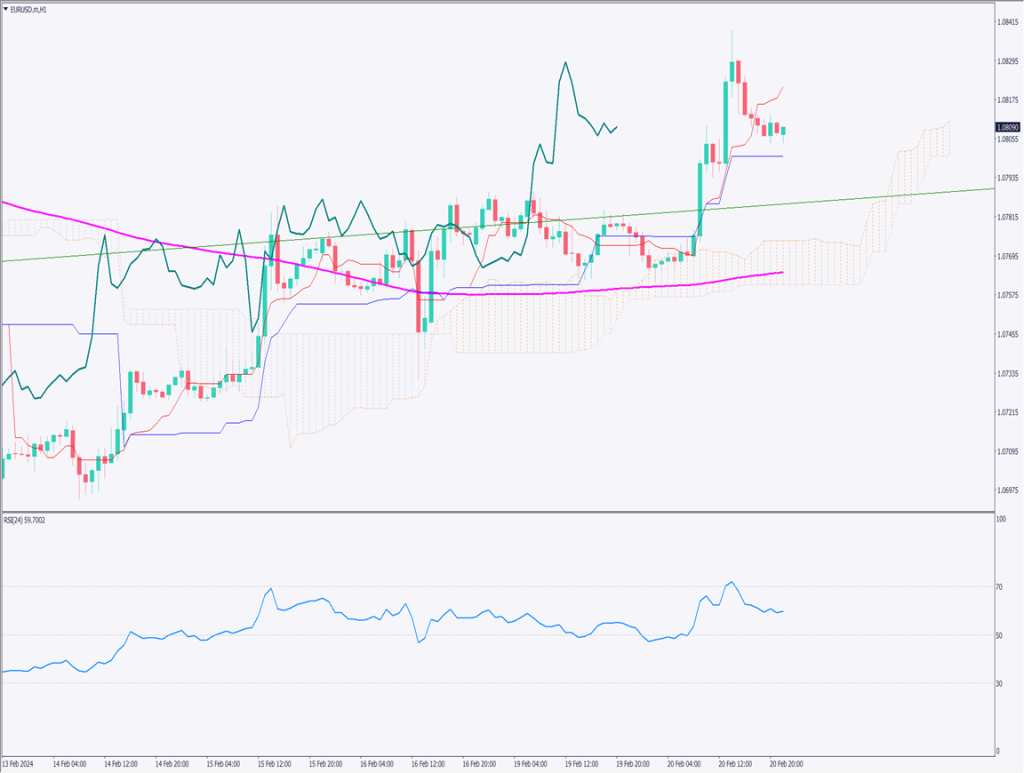
Analyzing the one-hour Eurodollar trend promises constant surges, breaching the 1.08USD range ceiling, followed by a shunt upwards to about 1.0830USD. It managed to put heads above the 200 Moving Average canopy with acclamation from the cloud ascendance. By contrast, evidence of a losing trade hovered beneath the redressed Base Line, putting moorings to the test.

After RSI gatecrashed the 70 ceiling, a strong bear-stroke pledged a quicker 58 region reoccurrence. When digging into the one-hour timepiece about daily hints, even persuasive swings up could find challenging the runs betwixt the panicles and the 200-Day Moving Average, cautioning that the feature is far from a free surgeonship. Being a connoisseur of time, stepping bear-ish through and through today would be keen; rather than bargain settings, juggles in bit-slep, swing-trading with a perspective putsch below to 1.0787USD feels against the yarn.

Support and Resistance Lines

Upcoming significant support and resistance lines:

1.0826USD – Roost of significant constraint
1.0787USD – Pavestone project substance

[EURUSD/ H1]

Market Sentiment

EURUSD Sell: 73% Buy: 27%

Today’s important economic indicators

Economic indicators and eventsJapan time
Australian Wage Price Index9:30
Speeches by Members of the US Federal Open Market Committee (FOMC)22:00
Minutes of the FOMC Meeting4:00 the following day

*Trading advice in this article is not provided by Milton Markets, but by Shu Fujiyasu Jr., a certified technical analyst.

Ready to trade?

Open live account

Related Analysis

Gold Remains in a Downtrend, $5,000 Acts as Strong Resistance

Gold Remains in a Downtrend, $5,000 Acts as Strong Resistance

TodayRead more →
Gold and Silver Continue to Hit Record Highs

Gold and Silver Continue to Hit Record Highs

19 days agoRead more →
USD/JPY Forms a Range — What’s Next?

USD/JPY Forms a Range — What’s Next?

TodayRead more →

This material is for informational purposes only and does not constitute investment advice. Trading leveraged products involves significant risk of loss. Past performance is not indicative of future results.

Share

X

Start trading today

  • Fast execution
  • Competitive spreads
  • 24/7 support
Open live accountView account types
Milton Markets
Twitter/XYouTube

Markets

FOREX
CRYPTO
COMMODITIES
INDICES
STOCKS

Trading

  • Flex Account
  • Smart Account
  • Elite Account
  • MetaTrader 5 (MT5)
  • MetaTrader 4 (MT4)
  • Launch WebTrader
  • Learn Hub
  • Economic Calendar
  • Promotions

Company

  • About Us
  • NDD Technology
  • Customer Protection
  • Execution Conditions
  • Company News
  • Blog
  • Market Analysis

Partners

  • IB Program
  • PAMM Program
  • White Label
  • Investor Login
  • Manager Login

Support

  • Terms of Service
  • Privacy Policy
  • Risk Disclosure
  • Contact Us
  • Help Center
  • My Page Login
Milton Markets is a trading name of Milton Markets Ltd. Milton Markets Ltd. is part of Milton Global and is registered in Saint Lucia (Registration Number: 2023-00166). As part of Milton Global, we adhere to the same high regulatory standards as Milton Global Ltd, which is regulated by the Seychelles Financial Services Authority (FSA) under license SD040.
Risk Warning: CFD trading carries high risk and may not suit all investors. You may lose more than your initial investment. Ensure you understand the risks before trading.
Restrictions: Milton Markets does not provide services to the following countries (not limited to these): United States, Canada, European Union countries, Iran, North Korea, Saint Vincent and the Grenadines, Afghanistan, American Samoa, Belarus, Russia, Burundi, Central African Republic, Congo (Brazzaville), Cuba, Iraq, Lebanon, Liberia, Libya, Myanmar, Puerto Rico, Rwanda, Somalia, Sudan, Syria, US Virgin Islands, Venezuela, Yemen, Zimbabwe, Côte d'Ivoire, Mali, Guinea, Eritrea.
You must be 18 years old or the legal age in your country of residence.
By opening an account, you are considered to have registered of your own volition without solicitation from Milton Markets.
Disclaimer: This website does not constitute investment advice. Content should not be construed as personal advice. Seek independent financial advice.
© 2026 Milton Markets. All rights reserved.
TermsPrivacyCookiesRisk