Milton Markets
Markets
Trading
Company
Partners
Sign InOpen Account
  1. Home/
  2. Market Analysis/
  3. Gold Rises, Dollar Index Falls Over the Week【February 26, 2024】
Koki Ando•Feb 26, 2024

Gold Rises, Dollar Index Falls Over the Week【February 26, 2024】

Koki Ando headshot

Daily Market Analysis

Koki AndoChief Market Analyst

Expert analysis of today's market movements and trading opportunities

Koki Ando headshot

Daily Market Analysis

Koki AndoChief Market Analyst

Expert analysis of today's market movements and trading opportunities

Fundamental Analysis

  • The Dollar Index fell, making gold relatively more attractive for purchase.
  • The Federal Reserve is cautious about rate cuts, and Nvidia’s earnings were good, suggesting the AI boom continues.
  • Comments from FOMC members later in the week are in focus as they search for the timing of rate cuts.

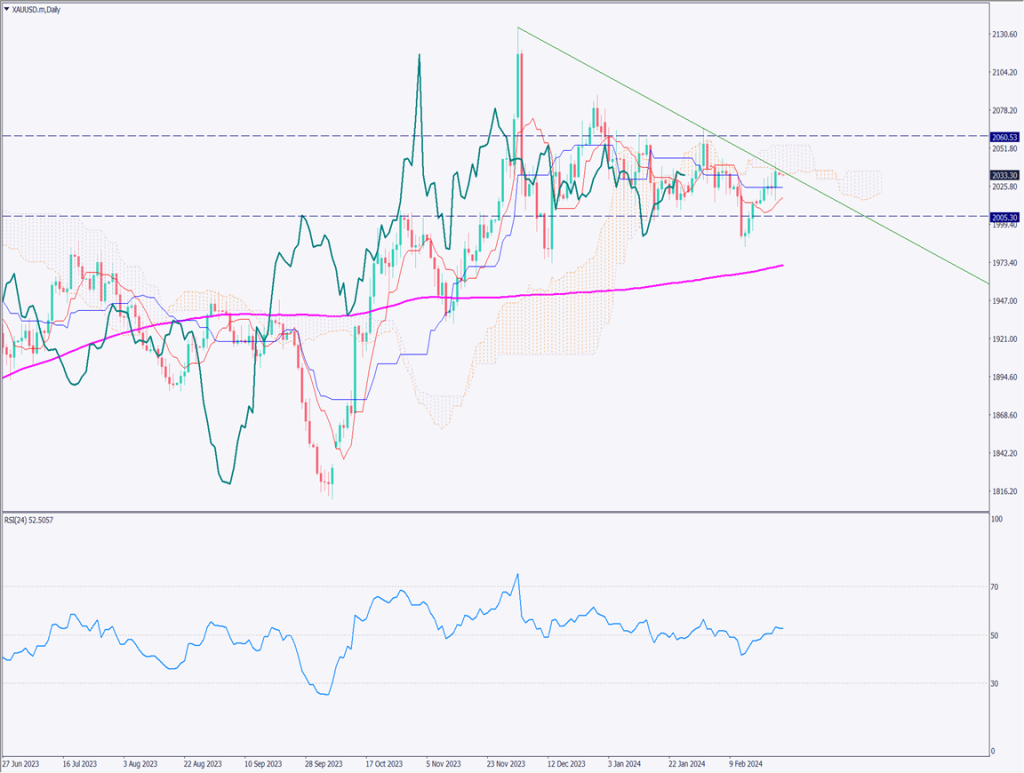
XAUUSD Technical Analysis

Analyzing the daily chart of gold, the descending trendline acts as resistance, and the Ichimoku cloud hovers above as an overhead resistance. The minutes from the Federal Reserve highlighted caution towards rate cuts, and the highly anticipated Nvidia earnings were very positive. Therefore, it is natural to expect a delay in the timing of rate cuts.

If the timing of rate cuts is pushed back, it could be a bearish factor for gold, but gold became relatively more attractive last week as the US Dollar Index fell. Whether there is a strong bullish factor for gold at present remains questionable.

As such, it might be expected that selling on rallies could be a likely strategy.

[XAUUSD/ D1]

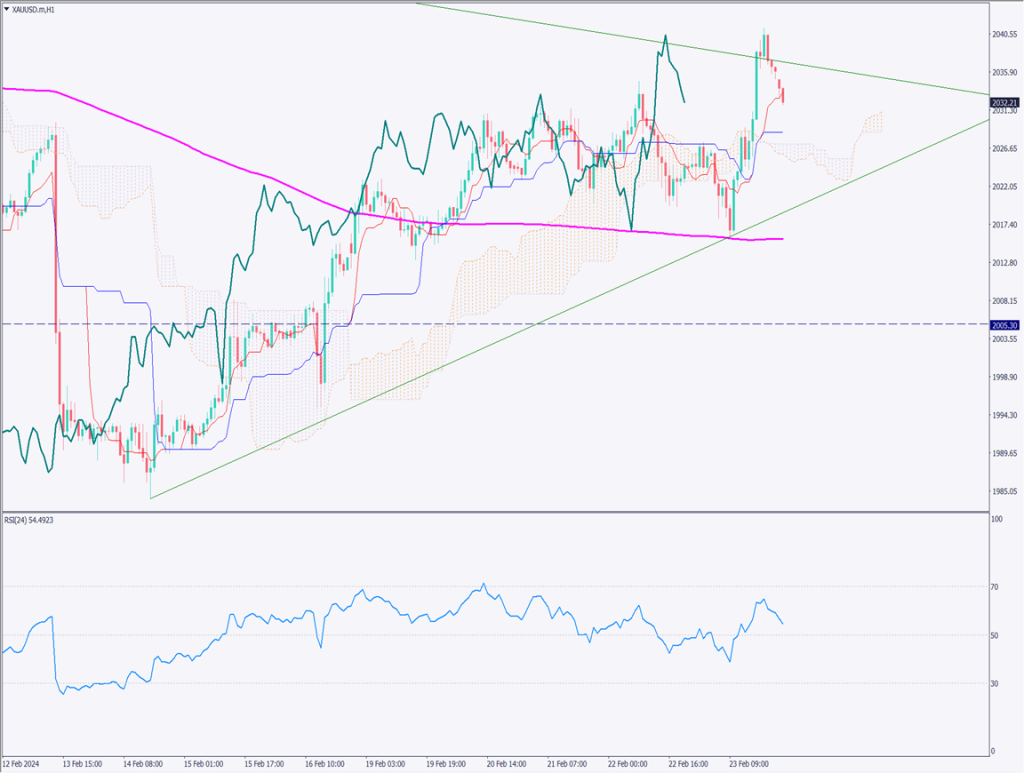
Day Trading Strategy (1-Hour Chart)

Analyzing the 1-hour chart of gold, it had risen to around USD 2040 but has since pulled back. At the time of writing, it is trading around USD 2030, with the RSI gently declining.

Since the RSI has not dropped below 50, it cannot be judged as a downtrend, but considering the fundamentals alone, there seems to be a high possibility of a decline. At this point, as technical conditions are not fully met, it is advised to avoid easy entries.

For day trading, the strategy would be to aim for selling on rallies in the long term. The target is around USD 2020, with a trial sell near USD 2035. If recent highs of USD 2041 are exceeded, it would be necessary to reconsider the bearish perspective.

Support and Resistance Lines

Upcoming significant support and resistance lines:

USD 2045 – Major resistance line
USD 2005 – Major support line

[XAUUSD/ H1]

Market Sentiment

XAUUSD Sell: 74% Buy: 26%

Today’s important economic indicators

Economic indicators and eventsJapan time
Bank of England Committee Member Speech20:00
US Building Permits22:00

*Trading advice in this article is not provided by Milton Markets, but by Shu Fujiyasu Jr., a certified technical analyst.

Ready to trade?

Open live account

Related Analysis

Gold and Silver Continue to Hit Record Highs

Gold and Silver Continue to Hit Record Highs

19 days agoRead more →
Gold Remains in a Downtrend, $5,000 Acts as Strong Resistance

Gold Remains in a Downtrend, $5,000 Acts as Strong Resistance

TodayRead more →
Can Gold Renew Its Record High?

Can Gold Renew Its Record High?

10 days agoRead more →

This material is for informational purposes only and does not constitute investment advice. Trading leveraged products involves significant risk of loss. Past performance is not indicative of future results.

Share

X

Start trading today

  • Fast execution
  • Competitive spreads
  • 24/7 support
Open live accountView account types
Milton Markets
Twitter/XYouTube

Markets

FOREX
CRYPTO
COMMODITIES
INDICES
STOCKS

Trading

  • Flex Account
  • Smart Account
  • Elite Account
  • MetaTrader 5 (MT5)
  • MetaTrader 4 (MT4)
  • Launch WebTrader
  • Learn Hub
  • Economic Calendar
  • Promotions

Company

  • About Us
  • NDD Technology
  • Customer Protection
  • Execution Conditions
  • Company News
  • Blog
  • Market Analysis

Partners

  • IB Program
  • PAMM Program
  • White Label
  • Investor Login
  • Manager Login

Support

  • Terms of Service
  • Privacy Policy
  • Risk Disclosure
  • Contact Us
  • Help Center
  • My Page Login
Milton Markets is a trading name of Milton Markets Ltd. Milton Markets Ltd. is part of Milton Global and is registered in Saint Lucia (Registration Number: 2023-00166). As part of Milton Global, we adhere to the same high regulatory standards as Milton Global Ltd, which is regulated by the Seychelles Financial Services Authority (FSA) under license SD040.
Risk Warning: CFD trading carries high risk and may not suit all investors. You may lose more than your initial investment. Ensure you understand the risks before trading.
Restrictions: Milton Markets does not provide services to the following countries (not limited to these): United States, Canada, European Union countries, Iran, North Korea, Saint Vincent and the Grenadines, Afghanistan, American Samoa, Belarus, Russia, Burundi, Central African Republic, Congo (Brazzaville), Cuba, Iraq, Lebanon, Liberia, Libya, Myanmar, Puerto Rico, Rwanda, Somalia, Sudan, Syria, US Virgin Islands, Venezuela, Yemen, Zimbabwe, Côte d'Ivoire, Mali, Guinea, Eritrea.
You must be 18 years old or the legal age in your country of residence.
By opening an account, you are considered to have registered of your own volition without solicitation from Milton Markets.
Disclaimer: This website does not constitute investment advice. Content should not be construed as personal advice. Seek independent financial advice.
© 2026 Milton Markets. All rights reserved.
TermsPrivacyCookiesRisk