Milton Markets
Markets
Trading
Company
Partners
Sign InOpen Account
  1. Home/
  2. Market Analysis/
  3. USDJPY Plummets to the 146 Range as US Unemployment Rate Hits a 2-Year High, Leading to Dollar Weakness【March 11, 2024】
Koki Ando•Mar 11, 2024

USDJPY Plummets to the 146 Range as US Unemployment Rate Hits a 2-Year High, Leading to Dollar Weakness【March 11, 2024】

Koki Ando headshot

Daily Market Analysis

Koki AndoChief Market Analyst

Expert analysis of today's market movements and trading opportunities

Koki Ando headshot

Daily Market Analysis

Koki AndoChief Market Analyst

Expert analysis of today's market movements and trading opportunities

Fundamental Analysis

  • USDJPY has plummeted to the 146 range, marking a drop of over 300 pips in just four days.
  • The unemployment rate in the US has risen to a 2-year high according to the employment statistics, and stock prices have also been weak.
  • The RSI for USDJPY has fallen below 50 for the first time since January, signaling the end of the uptrend.

USDJPY Technical Analysis

Analyzing the daily chart of USDJPY, it has hit the 200-day moving average and closed around 147. The rapid decline is attributed to anticipated yen buying ahead of the Bank of Japan’s meeting on the removal of negative interest rates, an increase in the US unemployment rate leading to dollar weakness, and comments on interest rate cuts by Federal Reserve officials.

USDJPY has broken below its previous highs, indicating the end of the uptrend. Moreover, the RSI has fallen below 50 for the first time since January, now at 41, indicating a downtrend.

Currently, the Ichimoku cloud lies below, making it difficult to break through swiftly. Some rebound is likely, possibly returning to the mid-148 range. However, fundamentally, a direction towards a stronger yen and weaker dollar seems probable.

[USDJPY/ D1]

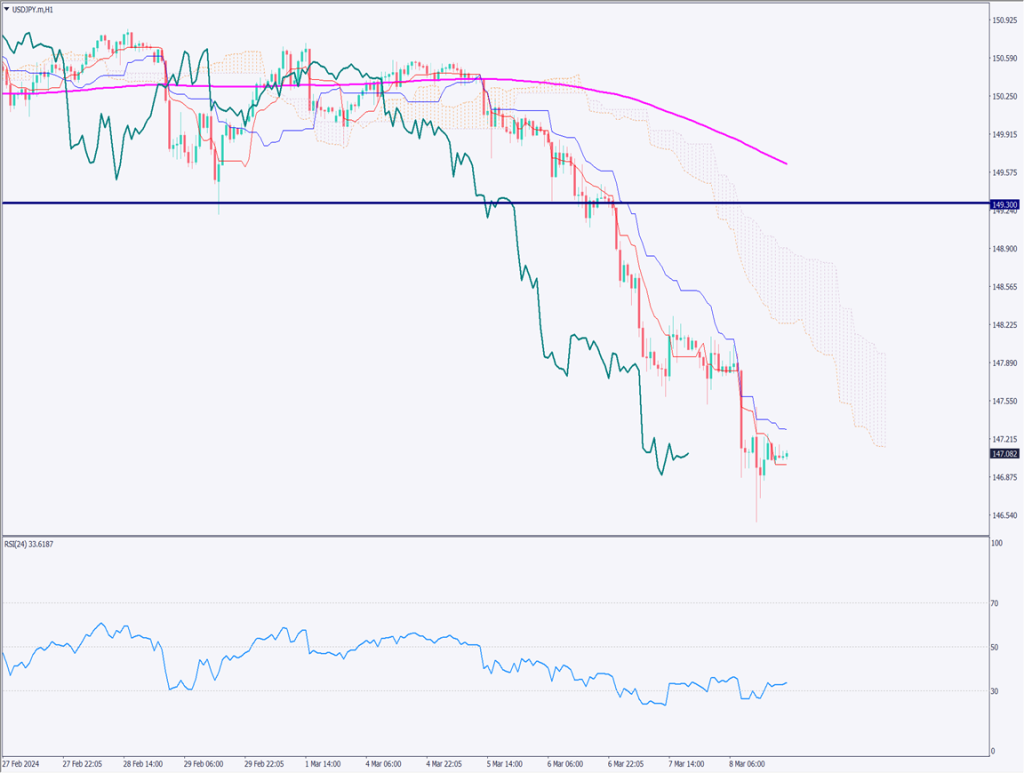
Day Trading Strategy (1-Hour Chart)

Analyzing the 1-hour chart of USDJPY, the downtrend continues. The conversion line of the Ichimoku cloud has acted as resistance, and after reaching a low of 146.50 JPY, it has finally surpassed the conversion line. However, it has not surpassed the baseline.

The price reaching 146.50 JPY, a significant price level, indicates that a rebound for adjustment wouldn’t be surprising. Drawing Fibonacci retracement levels, 38.2% corresponds to 148.15 JPY and 50% to 148.65 JPY, which are expected to form the rebound highs.

The day trading strategy is to sell on the rally. Wait until it reaches the 148 range before entering a sell position. The plan is to wait for the 1-hour RSI to return to around 50 before gradually increasing sell positions from 148.15 JPY to 148.50 JPY. If it surpasses 148.80 JPY, it indicates a different trend, and a stop loss should be placed.

Support and Resistance Lines

Key support and resistance lines to consider are as follows:

146.50 JPY: Monthly support line

[USDJPY/ H1]

Market Sentiment

USDJPY Sell: 9% Buy: 91%

Today’s important economic indicators

Economic indicators and eventsJapan time
Japan GDP8:50
Eurozone Finance Ministers Meeting19:00

*Trading advice in this article is not provided by Milton Markets, but by Shu Fujiyasu Jr., a certified technical analyst.

Ready to trade?

Open live account

Related Analysis

Gold and Silver Continue to Hit Record Highs

Gold and Silver Continue to Hit Record Highs

19 days agoRead more →
Can Gold Renew Its Record High?

Can Gold Renew Its Record High?

10 days agoRead more →
USD/JPY dips slightly on LDP landslide victory

USD/JPY dips slightly on LDP landslide victory

7 days agoRead more →

This material is for informational purposes only and does not constitute investment advice. Trading leveraged products involves significant risk of loss. Past performance is not indicative of future results.

Share

X

Start trading today

  • Fast execution
  • Competitive spreads
  • 24/7 support
Open live accountView account types
Milton Markets
Twitter/XYouTube

Markets

FOREX
CRYPTO
COMMODITIES
INDICES
STOCKS

Trading

  • Flex Account
  • Smart Account
  • Elite Account
  • MetaTrader 5 (MT5)
  • MetaTrader 4 (MT4)
  • Launch WebTrader
  • Learn Hub
  • Economic Calendar
  • Promotions

Company

  • About Us
  • NDD Technology
  • Customer Protection
  • Execution Conditions
  • Company News
  • Blog
  • Market Analysis

Partners

  • IB Program
  • PAMM Program
  • White Label
  • Investor Login
  • Manager Login

Support

  • Terms of Service
  • Privacy Policy
  • Risk Disclosure
  • Contact Us
  • Help Center
  • My Page Login
Milton Markets is a trading name of Milton Markets Ltd. Milton Markets Ltd. is part of Milton Global and is registered in Saint Lucia (Registration Number: 2023-00166). As part of Milton Global, we adhere to the same high regulatory standards as Milton Global Ltd, which is regulated by the Seychelles Financial Services Authority (FSA) under license SD040.
Risk Warning: CFD trading carries high risk and may not suit all investors. You may lose more than your initial investment. Ensure you understand the risks before trading.
Restrictions: Milton Markets does not provide services to the following countries (not limited to these): United States, Canada, European Union countries, Iran, North Korea, Saint Vincent and the Grenadines, Afghanistan, American Samoa, Belarus, Russia, Burundi, Central African Republic, Congo (Brazzaville), Cuba, Iraq, Lebanon, Liberia, Libya, Myanmar, Puerto Rico, Rwanda, Somalia, Sudan, Syria, US Virgin Islands, Venezuela, Yemen, Zimbabwe, Côte d'Ivoire, Mali, Guinea, Eritrea.
You must be 18 years old or the legal age in your country of residence.
By opening an account, you are considered to have registered of your own volition without solicitation from Milton Markets.
Disclaimer: This website does not constitute investment advice. Content should not be construed as personal advice. Seek independent financial advice.
© 2026 Milton Markets. All rights reserved.
TermsPrivacyCookiesRisk