Milton Markets
Markets
Trading
Company
Partners
Sign InOpen Account
  1. Home/
  2. Market Analysis/
  3. Gold Consolidates, Anticipation of ECB Rate Cut May Boost Sentiment【March 26, 2024】
Koki Ando•Mar 26, 2024

Gold Consolidates, Anticipation of ECB Rate Cut May Boost Sentiment【March 26, 2024】

Koki Ando headshot

Daily Market Analysis

Koki AndoChief Market Analyst

Expert analysis of today's market movements and trading opportunities

Koki Ando headshot

Daily Market Analysis

Koki AndoChief Market Analyst

Expert analysis of today's market movements and trading opportunities

Fundamental Analysis

  • Waiting for the US Core PCE Price Index, CPI announcements from European countries also expected this week
  • June rate cut by ECB anticipated, could be bullish for gold
  • Rate cut timing could become clearer with CPI data from the US and Europe, potentially lifting gold

XAUUSD Technical Analysis

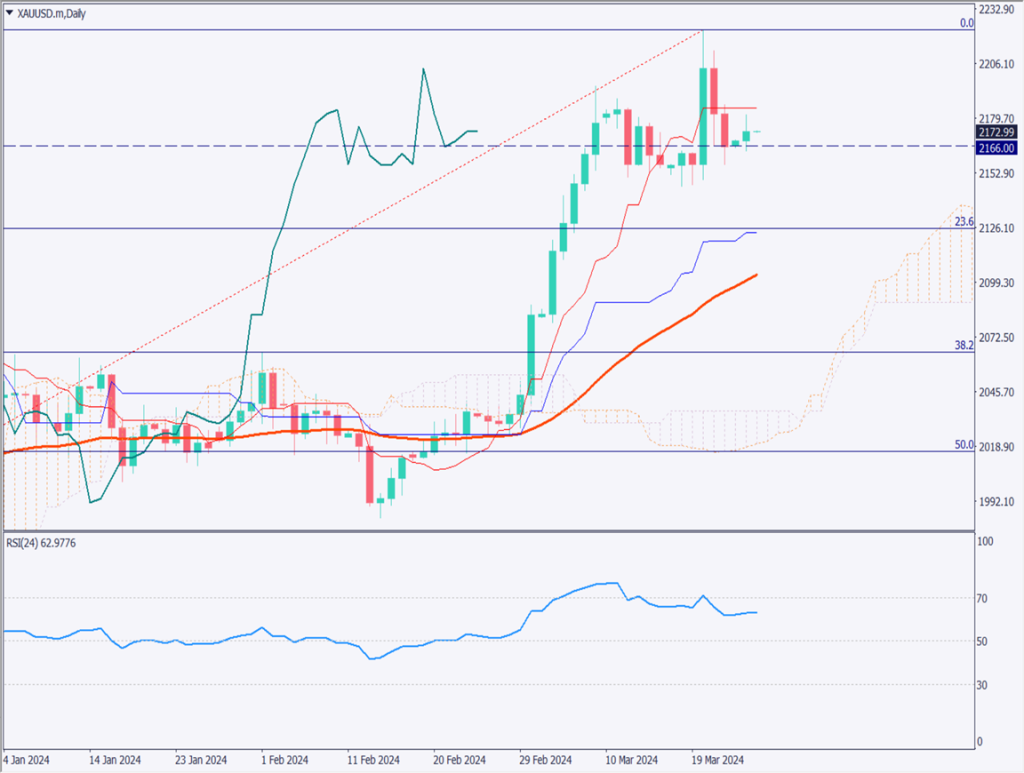
Considering gold’s daily charts and fundamentals. It has broken below the Ichimoku Cloud’s conversion line, indicating a consolidation phase. Specifically, it is forming a range between 2150USD and 2200USD, searching for direction.

The conversion line tends to act as support/resistance during strong trends, and currently being below it suggests at least a pause in momentum.

Gold could find bullish factors with this week’s PCE Price Index and CPI announcements from the US and Europe, clarifying the timing of rate cuts by the Fed and ECB. If gold’s daily close surpasses the conversion line again at 2184USD, testing 2200USD could be possible. Conversely, falling below the support line at 2145USD could lead to a deeper correction, with a potential drop to around the baseline at 2125USD.

[XAUUSD/ D1]

Day Trading Strategy (1-Hour Chart)

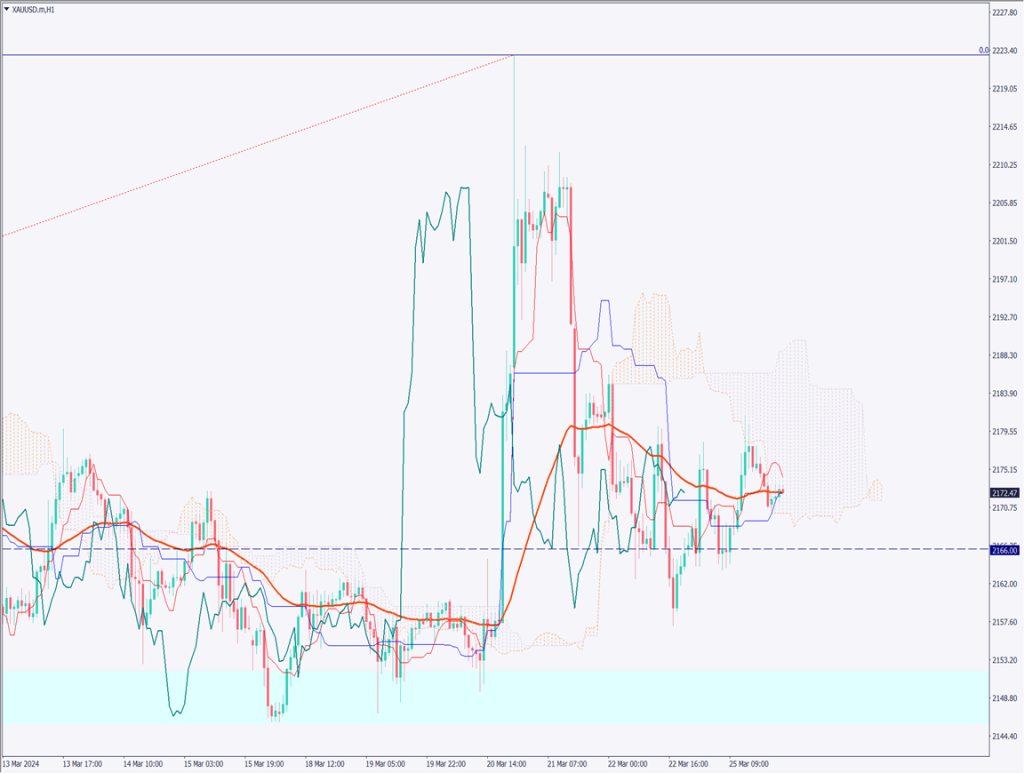
Analyzing gold’s 1-hour chart. A thick cloud above suggests a heavy upside, with a narrow range indicating indecisiveness. It has rebounded off the 52 moving average, with previous rebounds off the 240 moving average as well.

A key level to watch might be 2166USD. Material is needed to break below where the 200 moving average and a major support line converge. If it dips below 2166USD, the next support line is at 2161USD on the 240 moving average. Falling below 2160USD could lead to 2155USD.

The day trading strategy favors buying dips. Placing a buy limit around 2160USD, with a stop at 2155USD and a target at 2166USD. Due to sluggish movement, if the limit order doesn’t execute, the plan is to hold off on trading.

Support and Resistance Lines

Key support and resistance lines to consider are as follows:

2270USD – 100% Fibonacci level on the weekly chart

2166USD – A major support line

2095USD – Fibonacci level on the weekly chart

[XAUUSD/ H1]

Market Sentiment

XAUUSD Sell: 62% Buy: 38%

Today’s important economic indicators

Economic indicators and eventsJapan time
Bank of Japan Core CPI14:00
US Core Durable Goods Orders21:30
US Consumer Confidence Index23:00

*Trading advice in this article is not provided by Milton Markets, but by Shu Fujiyasu Jr., a certified technical analyst.

Ready to trade?

Open live account

Related Analysis

USD/JPY dips slightly on LDP landslide victory

USD/JPY dips slightly on LDP landslide victory

7 days agoRead more →
Can Gold Renew Its Record High?

Can Gold Renew Its Record High?

10 days agoRead more →
No Currency Intervention Conducted; Reports of Additional Tariffs on South Korea

No Currency Intervention Conducted; Reports of Additional Tariffs on South Korea

20 days agoRead more →

This material is for informational purposes only and does not constitute investment advice. Trading leveraged products involves significant risk of loss. Past performance is not indicative of future results.

Share

X

Start trading today

  • Fast execution
  • Competitive spreads
  • 24/7 support
Open live accountView account types
Milton Markets
Twitter/XYouTube

Markets

FOREX
CRYPTO
COMMODITIES
INDICES
STOCKS

Trading

  • Flex Account
  • Smart Account
  • Elite Account
  • MetaTrader 5 (MT5)
  • MetaTrader 4 (MT4)
  • Launch WebTrader
  • Learn Hub
  • Economic Calendar
  • Promotions

Company

  • About Us
  • NDD Technology
  • Customer Protection
  • Execution Conditions
  • Company News
  • Blog
  • Market Analysis

Partners

  • IB Program
  • PAMM Program
  • White Label
  • Investor Login
  • Manager Login

Support

  • Terms of Service
  • Privacy Policy
  • Risk Disclosure
  • Contact Us
  • Help Center
  • My Page Login
Milton Markets is a trading name of Milton Markets Ltd. Milton Markets Ltd. is part of Milton Global and is registered in Saint Lucia (Registration Number: 2023-00166). As part of Milton Global, we adhere to the same high regulatory standards as Milton Global Ltd, which is regulated by the Seychelles Financial Services Authority (FSA) under license SD040.
Risk Warning: CFD trading carries high risk and may not suit all investors. You may lose more than your initial investment. Ensure you understand the risks before trading.
Restrictions: Milton Markets does not provide services to the following countries (not limited to these): United States, Canada, European Union countries, Iran, North Korea, Saint Vincent and the Grenadines, Afghanistan, American Samoa, Belarus, Russia, Burundi, Central African Republic, Congo (Brazzaville), Cuba, Iraq, Lebanon, Liberia, Libya, Myanmar, Puerto Rico, Rwanda, Somalia, Sudan, Syria, US Virgin Islands, Venezuela, Yemen, Zimbabwe, Côte d'Ivoire, Mali, Guinea, Eritrea.
You must be 18 years old or the legal age in your country of residence.
By opening an account, you are considered to have registered of your own volition without solicitation from Milton Markets.
Disclaimer: This website does not constitute investment advice. Content should not be construed as personal advice. Seek independent financial advice.
© 2026 Milton Markets. All rights reserved.
TermsPrivacyCookiesRisk