Milton Markets
Markets
Trading
Company
Partners
Sign InOpen Account
  1. Home/
  2. Market Analysis/
  3. Gold Reaches All-Time High, Aiming for the 2300 USD Range But Overheating is a Concern【April 1, 2024】
Koki Ando•Apr 1, 2024

Gold Reaches All-Time High, Aiming for the 2300 USD Range But Overheating is a Concern【April 1, 2024】

Koki Ando headshot

Daily Market Analysis

Koki AndoChief Market Analyst

Expert analysis of today's market movements and trading opportunities

Koki Ando headshot

Daily Market Analysis

Koki AndoChief Market Analyst

Expert analysis of today's market movements and trading opportunities

Fundamental Analysis

  • The Chairman of the U.S. Federal Reserve, Powell, commented that there is no rush to lower interest rates, showing a cautious stance.
  • The Easter holiday ends today, volatility may increase from tomorrow.
  • Gold hits the +2σ line of the Bollinger Bands.

XAUUSD Technical Analysis

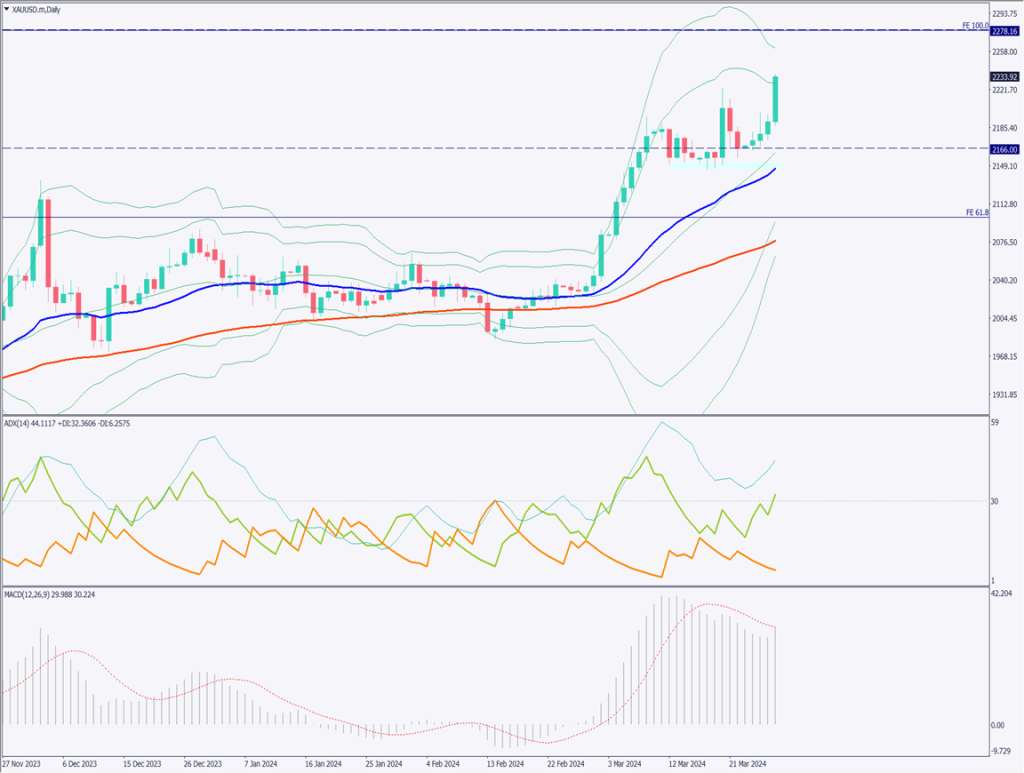
The price of gold has updated its all-time high, significantly surpassing the previous high of 2222 USD, indicating an upward trend according to Dow Theory.

When plotting the Fibonacci expansion on the weekly chart, the 100% line is located around 2278 USD, which requires attention. Additionally, the daily Bollinger Bands show the current price slightly above the +2σ line, suggesting the possibility of a fallback.

Analysis of the ADX shows a current value of 44, with +DI at 32, indicating a strong upward trend. Furthermore, the MACD suggests the histogram may surpass the MACD line again in the future.

With the +3σ line of the Bollinger Bands at 2260 USD, exceeding this level could increase the risk of a fallback. Therefore, investors currently holding positions might consider this a good time for profit-taking.

Various technical indicators suggest a strong upward trend in the gold market, but also hint at the possibility of a short-term correction, warranting cautious trading.

[XAUUSD/ D1]

Day Trading Strategy (1-Hour Chart)

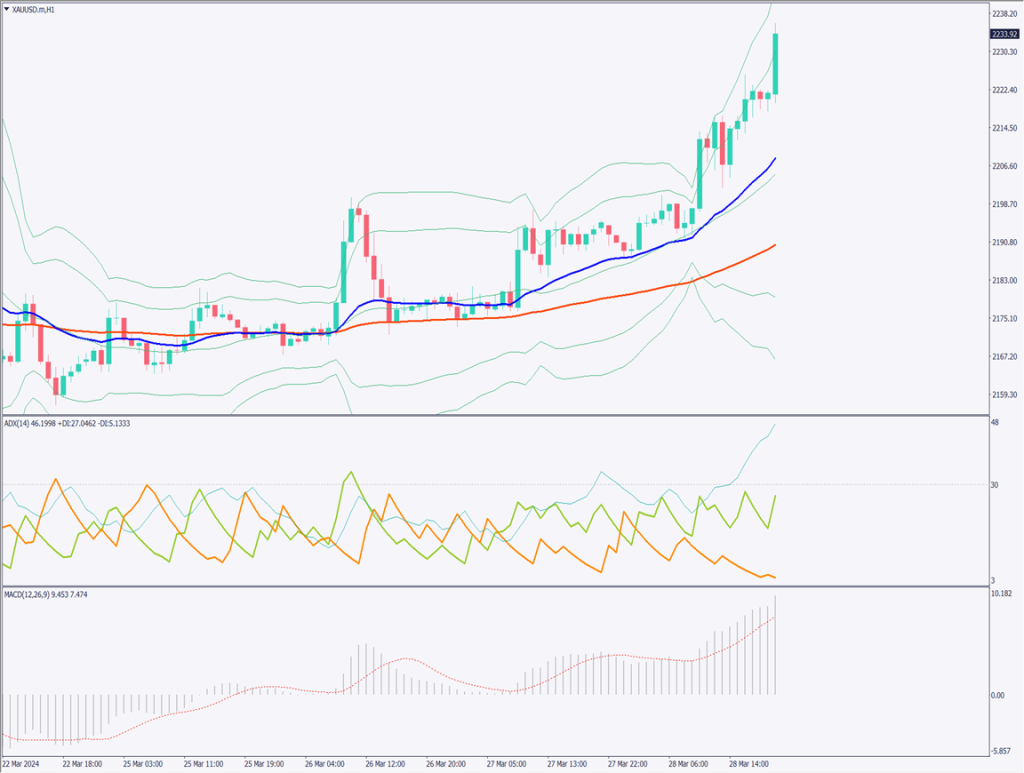
Analysis of the 1-hour chart of gold shows an uptrend opening with a gap, starting from a high of 2245 USD. Despite the Chairman of the Federal Reserve’s consistent stance on not rushing interest rate cuts, factors such as the PCE price index meeting expectations continue to apply upward pressure.

However, the ADX is below 30, and the histogram is below the MACD. Today is the last day of the Easter holiday, with markets in Europe, Australia, and Hong Kong closed, leading to reduced trading volume in gold.

The day trading strategy considers buying at deep dips. If it reaches the 2220 USD range, consider entering a buy. The settlement is around 2260 USD, with a stop loss at 2215 USD.

Support and Resistance Lines

The following are support and resistance lines to consider:

2278 USD – Daily Fibonacci 100% price range

2260 USD – Daily Bollinger Band +3σ line

[XAUUSD/ H1]

Market Sentiment

XAUUSD Sell: 69%, Buy: 31%

Today’s important economic indicators

Economic indicators and eventsJapan time
European, Australian, and Hong Kong stock markets closed–
Bank of Japan Short-Term Economic Survey08:50
U.S. ISM Manufacturing PMI23:00

*Trading advice in this article is not provided by Milton Markets, but by Shu Fujiyasu Jr., a certified technical analyst.

Ready to trade?

Open live account

Related Analysis

USD/JPY dips slightly on LDP landslide victory

USD/JPY dips slightly on LDP landslide victory

7 days agoRead more →
Gold and Silver Continue to Hit Record Highs

Gold and Silver Continue to Hit Record Highs

19 days agoRead more →
Can Gold Renew Its Record High?

Can Gold Renew Its Record High?

10 days agoRead more →

This material is for informational purposes only and does not constitute investment advice. Trading leveraged products involves significant risk of loss. Past performance is not indicative of future results.

Share

X

Start trading today

  • Fast execution
  • Competitive spreads
  • 24/7 support
Open live accountView account types
Milton Markets
Twitter/XYouTube

Markets

FOREX
CRYPTO
COMMODITIES
INDICES
STOCKS

Trading

  • Flex Account
  • Smart Account
  • Elite Account
  • MetaTrader 5 (MT5)
  • MetaTrader 4 (MT4)
  • Launch WebTrader
  • Learn Hub
  • Economic Calendar
  • Promotions

Company

  • About Us
  • NDD Technology
  • Customer Protection
  • Execution Conditions
  • Company News
  • Blog
  • Market Analysis

Partners

  • IB Program
  • PAMM Program
  • White Label
  • Investor Login
  • Manager Login

Support

  • Terms of Service
  • Privacy Policy
  • Risk Disclosure
  • Contact Us
  • Help Center
  • My Page Login
Milton Markets is a trading name of Milton Markets Ltd. Milton Markets Ltd. is part of Milton Global and is registered in Saint Lucia (Registration Number: 2023-00166). As part of Milton Global, we adhere to the same high regulatory standards as Milton Global Ltd, which is regulated by the Seychelles Financial Services Authority (FSA) under license SD040.
Risk Warning: CFD trading carries high risk and may not suit all investors. You may lose more than your initial investment. Ensure you understand the risks before trading.
Restrictions: Milton Markets does not provide services to the following countries (not limited to these): United States, Canada, European Union countries, Iran, North Korea, Saint Vincent and the Grenadines, Afghanistan, American Samoa, Belarus, Russia, Burundi, Central African Republic, Congo (Brazzaville), Cuba, Iraq, Lebanon, Liberia, Libya, Myanmar, Puerto Rico, Rwanda, Somalia, Sudan, Syria, US Virgin Islands, Venezuela, Yemen, Zimbabwe, Côte d'Ivoire, Mali, Guinea, Eritrea.
You must be 18 years old or the legal age in your country of residence.
By opening an account, you are considered to have registered of your own volition without solicitation from Milton Markets.
Disclaimer: This website does not constitute investment advice. Content should not be construed as personal advice. Seek independent financial advice.
© 2026 Milton Markets. All rights reserved.
TermsPrivacyCookiesRisk