Milton Markets
Markets
Trading
Company
Partners
Sign InOpen Account
  1. Home/
  2. Market Analysis/
  3. USDJPY Maintains Levels Around 153 JPY, Dollar Rises Amid Risk Aversion【April 15, 2024】
Koki Ando•Apr 15, 2024

USDJPY Maintains Levels Around 153 JPY, Dollar Rises Amid Risk Aversion【April 15, 2024】

Koki Ando headshot

Daily Market Analysis

Koki AndoChief Market Analyst

Expert analysis of today's market movements and trading opportunities

Koki Ando headshot

Daily Market Analysis

Koki AndoChief Market Analyst

Expert analysis of today's market movements and trading opportunities

Fundamental Analysis

  • Iran declares the end of its retaliatory operation against Israel with minimal damage.
  • Despite rising risk aversion, there is no buying of JPY, and the dollar strengthens.
  • Gold rises to 2430 USD but then falls back, forming a top wick.

USDJPY technical analysis

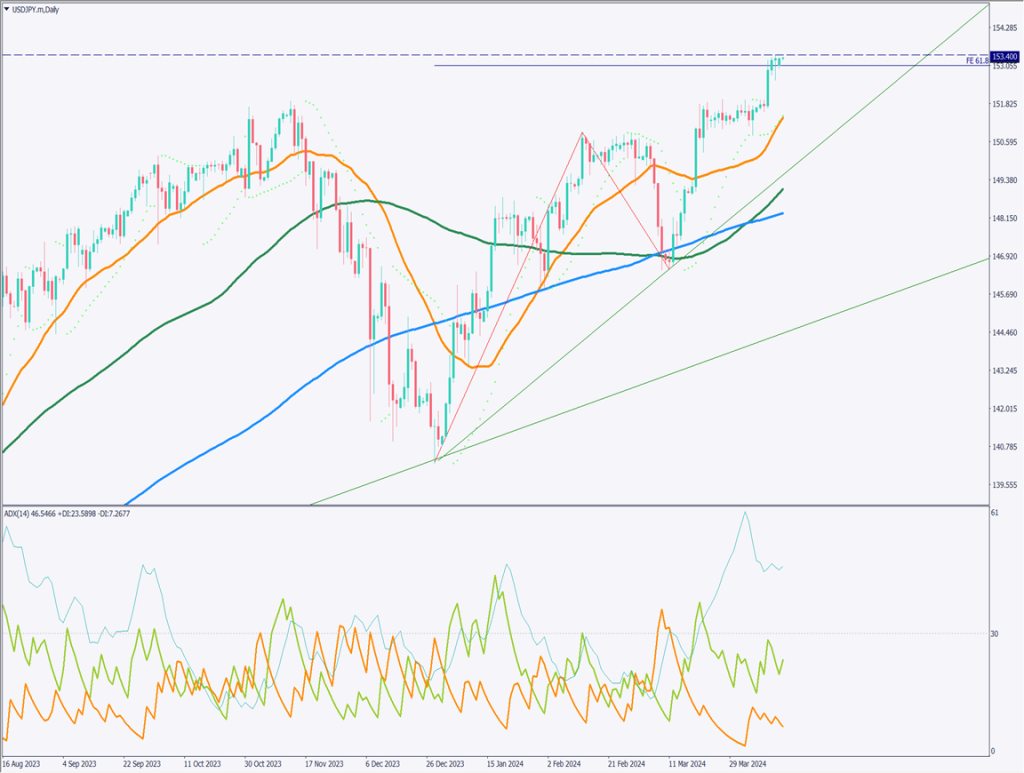
Analyzing the daily chart for USDJPY, it is trading around 153.40 JPY. Over the weekend, Iran directly attacked Israel, increasing geopolitical risks, but Iran has declared the operation over.
For now, a full confrontation seems to be avoided. However, the situation remains unstable, and risk-averse moves are becoming more apparent. The Forex market is moving towards a stronger dollar, and USDJPY has stopped falling below the 153 JPY range. There is a significant resistance line at 153.40 JPY, and an adjustment could happen.
U.S. stock prices have significantly dropped, and as May approaches—commonly referred to as “Sell in May”—the upward trend is adjusting.

[USDJPY/ D1]

Day trading strategy (1 hour)

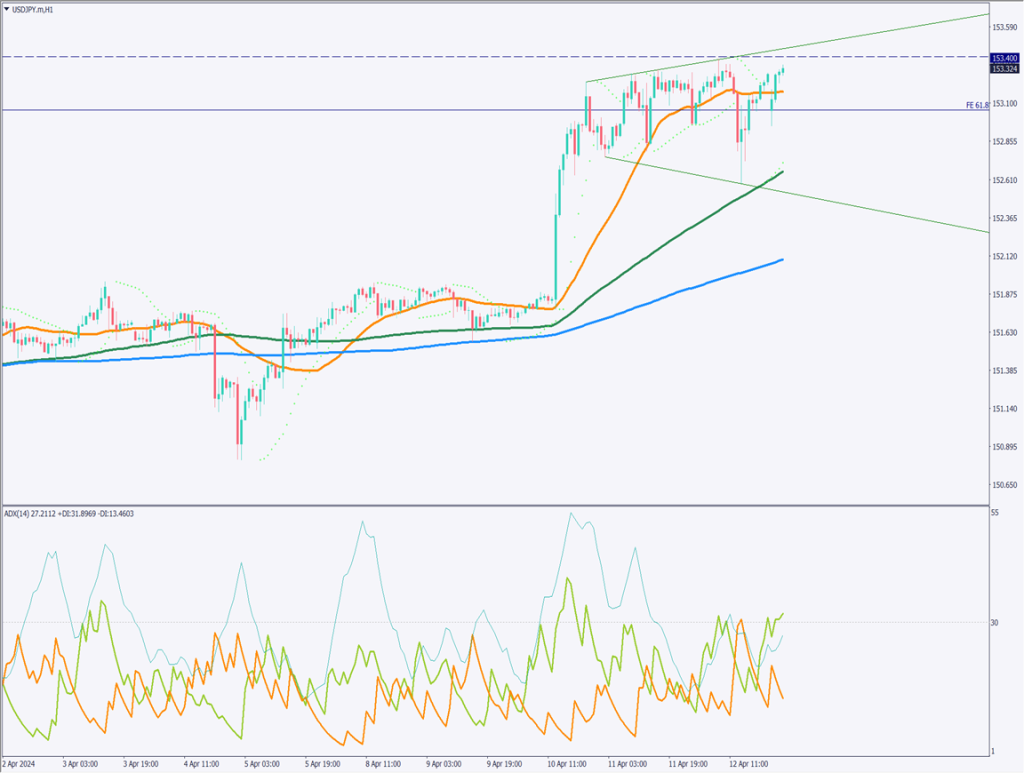
Analyzing the 1-hour chart for USDJPY, it is forming an expanding triangle. This pattern indicates instability in the market and, if it occurs mid-uptrend, typically results in a breakout of the upper line.
The rise in geopolitical risks and the delay in the timing of U.S. rate cuts suggest that the strong dollar will not stop soon. USDJPY is expected to eventually target 155 JPY. However, some consolidation is likely to continue for a while.
The day trading approach would be to buy on dips. Entry is planned around 152.75 JPY, with a target of 153.35 JPY. The stop would be around 152.45 JPY.

Support/Resistance lines

Future consideration for support and resistance lines are as follows:

153.40 JPY – A monthly resistance line/recent high

[USDJPY/ H1]

Market Sentiment

USDJPY Sell: 77% Buy: 23%

Featured Currency Pair of the Week (AUDJPY)

AUDJPY rebounds at 98.85 JPY. The 1-hour chart shows an expected return to the 28-moving average line at 99.50 JPY. The resistance line at 100 JPY is strong, but it may eventually breakout.
Attention should be paid to whether it will fall back from the 28-moving average line. If it does, it might drop to 98.60 JPY.

Today’s important economic indicators

Economic indicators and eventsJapan time
U.S. Core Retail Sales21:30
U.S. NY Fed Manufacturing Index21:30

*Trading advice in this article is not provided by Milton Markets, but by Shu Fujiyasu Jr., a certified technical analyst.

Ready to trade?

Open live account

Related Analysis

USD/JPY dips slightly on LDP landslide victory

USD/JPY dips slightly on LDP landslide victory

7 days agoRead more →
Gold and Silver Continue to Hit Record Highs

Gold and Silver Continue to Hit Record Highs

19 days agoRead more →
USD/JPY: Selling Pressure Dominates on Rallies

USD/JPY: Selling Pressure Dominates on Rallies

6 days agoRead more →

This material is for informational purposes only and does not constitute investment advice. Trading leveraged products involves significant risk of loss. Past performance is not indicative of future results.

Share

X

Start trading today

  • Fast execution
  • Competitive spreads
  • 24/7 support
Open live accountView account types
Milton Markets
Twitter/XYouTube

Markets

FOREX
CRYPTO
COMMODITIES
INDICES
STOCKS

Trading

  • Flex Account
  • Smart Account
  • Elite Account
  • MetaTrader 5 (MT5)
  • MetaTrader 4 (MT4)
  • Launch WebTrader
  • Learn Hub
  • Economic Calendar
  • Promotions

Company

  • About Us
  • NDD Technology
  • Customer Protection
  • Execution Conditions
  • Company News
  • Blog
  • Market Analysis

Partners

  • IB Program
  • PAMM Program
  • White Label
  • Investor Login
  • Manager Login

Support

  • Terms of Service
  • Privacy Policy
  • Risk Disclosure
  • Contact Us
  • Help Center
  • My Page Login
Milton Markets is a trading name of Milton Markets Ltd. Milton Markets Ltd. is part of Milton Global and is registered in Saint Lucia (Registration Number: 2023-00166). As part of Milton Global, we adhere to the same high regulatory standards as Milton Global Ltd, which is regulated by the Seychelles Financial Services Authority (FSA) under license SD040.
Risk Warning: CFD trading carries high risk and may not suit all investors. You may lose more than your initial investment. Ensure you understand the risks before trading.
Restrictions: Milton Markets does not provide services to the following countries (not limited to these): United States, Canada, European Union countries, Iran, North Korea, Saint Vincent and the Grenadines, Afghanistan, American Samoa, Belarus, Russia, Burundi, Central African Republic, Congo (Brazzaville), Cuba, Iraq, Lebanon, Liberia, Libya, Myanmar, Puerto Rico, Rwanda, Somalia, Sudan, Syria, US Virgin Islands, Venezuela, Yemen, Zimbabwe, Côte d'Ivoire, Mali, Guinea, Eritrea.
You must be 18 years old or the legal age in your country of residence.
By opening an account, you are considered to have registered of your own volition without solicitation from Milton Markets.
Disclaimer: This website does not constitute investment advice. Content should not be construed as personal advice. Seek independent financial advice.
© 2026 Milton Markets. All rights reserved.
TermsPrivacyCookiesRisk