Milton Markets
Markets
Trading
Company
Partners
Sign InOpen Account
  1. Home/
  2. Market Analysis/
  3. Gold Hits a Ceiling, Japan-US-Korea Finance Ministers Meeting Held【April 18, 2024】
Koki Ando•Apr 18, 2024

Gold Hits a Ceiling, Japan-US-Korea Finance Ministers Meeting Held【April 18, 2024】

Koki Ando headshot

Daily Market Analysis

Koki AndoChief Market Analyst

Expert analysis of today's market movements and trading opportunities

Koki Ando headshot

Daily Market Analysis

Koki AndoChief Market Analyst

Expert analysis of today's market movements and trading opportunities

Fundamental Analysis

  • The Japan-US-Korea finance ministers’ meeting was held, sharing concerns over the USD appreciation affecting Japan and Korea
  • The foreign exchange market saw widespread USD weakness following remarks aimed at curbing USD strength
  • Gold fell to around 2360USD but saw buying at lower prices as a safe-haven asset

XAUUSD technical analysis

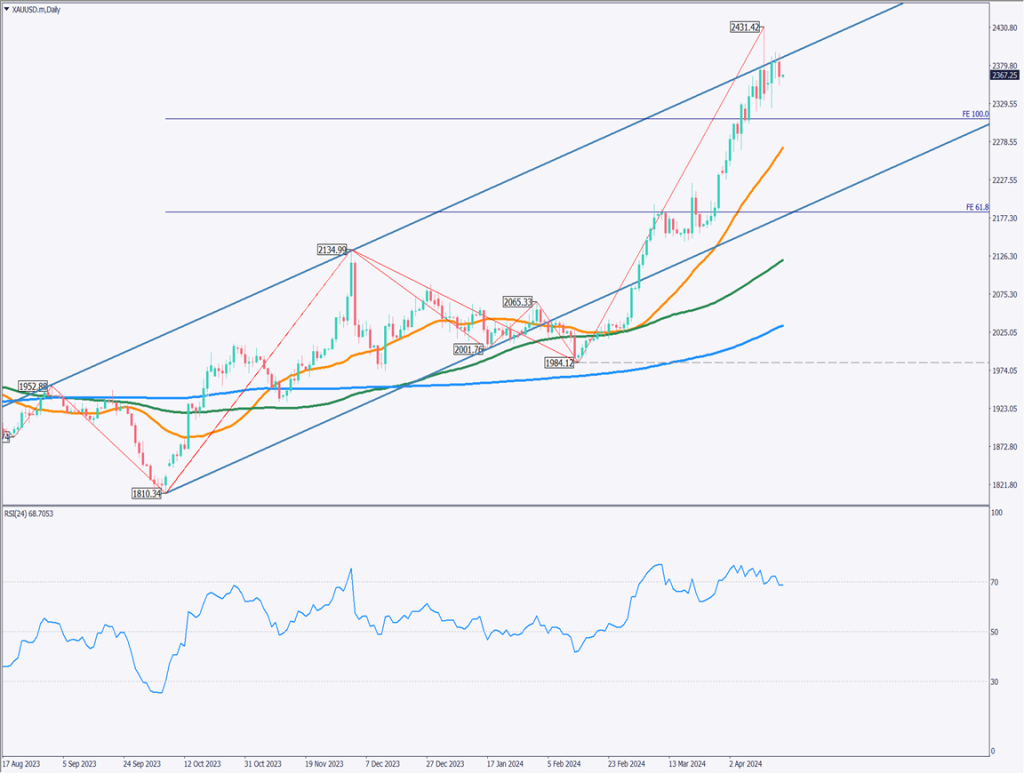
Analyzing the daily chart of gold, it can be seen that it has hit the upper limit of the parallel channel based on key highs and lows. Recently, unilateral progress in USD appreciation has been noted, with emerging countries expressing concerns.

Should there be coordinated intervention by various countries, a significant adjustment could occur. Technically, the RSI has dipped below 70 to 68, commonly considered a sell signal.

The daily scenario suggests a potential correction to the 2310USD level, corresponding to the 100% Fibonacci expansion.

[XAUUSD/ D1]

Day trading strategy (1 hour)

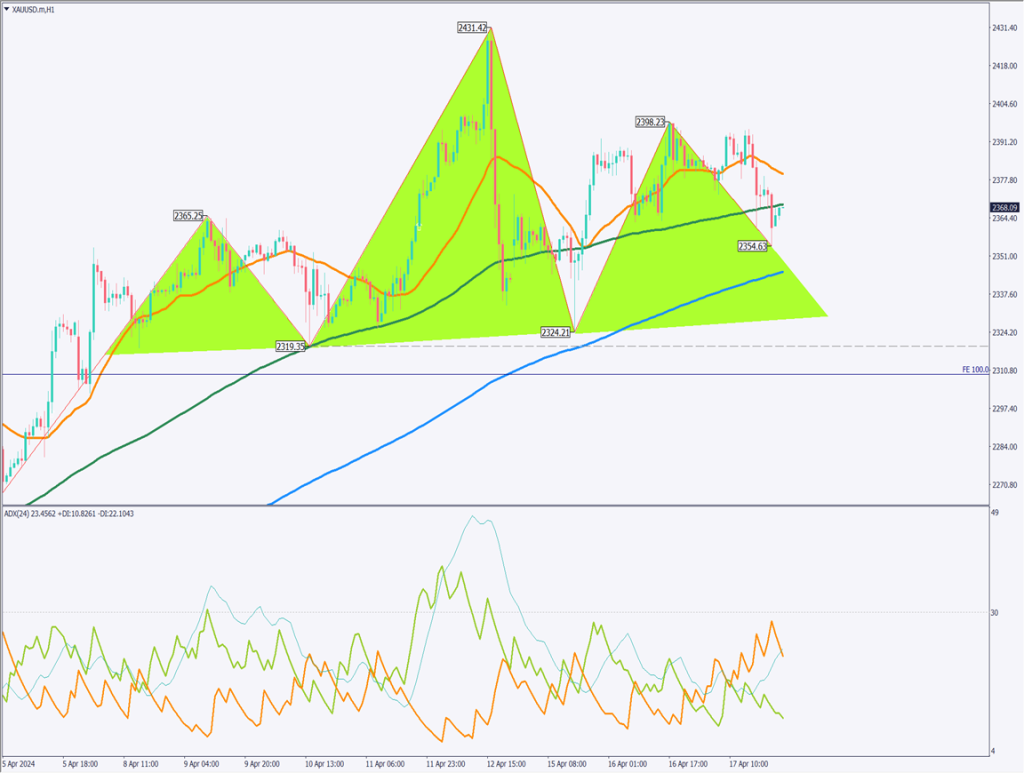
The 1-hour gold chart shows three major peaks, with the middle peak being the highest and the side peaks nearly at the same price level, forming a ‘Head and Shoulders’ pattern.

The pattern is not yet complete, but a fall to the neckline around 2320USD and a breakout below could lead to a further decline.
The impact of USD appreciation curbing and how countries coordinate their response will be crucial going forward. The market might see continued adjustments. A rebound is quite possible near the neckline.

At this stage, strategies include a market sell anticipating a fall to the neckline or a buy limit order anticipating a rebound at the neckline. The 240 moving average is at 2345USD, suggesting a potential drop to this level.

The day trading strategy is to sell on a breakout below 2360USD, settling at 2345USD, and placing a stop at 2370USD.

Support/Resistance lines

The following are key levels to consider:

2310USD – Fibonacci Expansion 100%

[XAUUSD/ H1]

Market Sentiment

XAUUSD Sell: 53% Buy: 47%

Featured Currency Pair of the Week (AUDJPY)

The AUDJPY is moving around the 28-day moving average. Today, Australian employment statistics are scheduled to be released, likely increasing volatility. As the USD leads the forex market, the direction for the cross yen pair AUDJPY is hard to discern.

The strategy is to scalp for small, consistent profits. The outcome of the Australian employment statistics will be critical in determining the direction of Australian interest rate policies.

Today’s important economic indicators

Economic indicators and eventsJapan time
Australian Employment Statistics10:30
US Philadelphia Fed Manufacturing Index21:30

*Trading advice in this article is not provided by Milton Markets, but by Shu Fujiyasu Jr., a certified technical analyst.

Ready to trade?

Open live account

Related Analysis

Can Gold Renew Its Record High?

Can Gold Renew Its Record High?

10 days agoRead more →
USD/JPY dips slightly on LDP landslide victory

USD/JPY dips slightly on LDP landslide victory

7 days agoRead more →
USD/JPY: Selling Pressure Dominates on Rallies

USD/JPY: Selling Pressure Dominates on Rallies

6 days agoRead more →

This material is for informational purposes only and does not constitute investment advice. Trading leveraged products involves significant risk of loss. Past performance is not indicative of future results.

Share

X

Start trading today

  • Fast execution
  • Competitive spreads
  • 24/7 support
Open live accountView account types
Milton Markets
Twitter/XYouTube

Markets

FOREX
CRYPTO
COMMODITIES
INDICES
STOCKS

Trading

  • Flex Account
  • Smart Account
  • Elite Account
  • MetaTrader 5 (MT5)
  • MetaTrader 4 (MT4)
  • Launch WebTrader
  • Learn Hub
  • Economic Calendar
  • Promotions

Company

  • About Us
  • NDD Technology
  • Customer Protection
  • Execution Conditions
  • Company News
  • Blog
  • Market Analysis

Partners

  • IB Program
  • PAMM Program
  • White Label
  • Investor Login
  • Manager Login

Support

  • Terms of Service
  • Privacy Policy
  • Risk Disclosure
  • Contact Us
  • Help Center
  • My Page Login
Milton Markets is a trading name of Milton Markets Ltd. Milton Markets Ltd. is part of Milton Global and is registered in Saint Lucia (Registration Number: 2023-00166). As part of Milton Global, we adhere to the same high regulatory standards as Milton Global Ltd, which is regulated by the Seychelles Financial Services Authority (FSA) under license SD040.
Risk Warning: CFD trading carries high risk and may not suit all investors. You may lose more than your initial investment. Ensure you understand the risks before trading.
Restrictions: Milton Markets does not provide services to the following countries (not limited to these): United States, Canada, European Union countries, Iran, North Korea, Saint Vincent and the Grenadines, Afghanistan, American Samoa, Belarus, Russia, Burundi, Central African Republic, Congo (Brazzaville), Cuba, Iraq, Lebanon, Liberia, Libya, Myanmar, Puerto Rico, Rwanda, Somalia, Sudan, Syria, US Virgin Islands, Venezuela, Yemen, Zimbabwe, Côte d'Ivoire, Mali, Guinea, Eritrea.
You must be 18 years old or the legal age in your country of residence.
By opening an account, you are considered to have registered of your own volition without solicitation from Milton Markets.
Disclaimer: This website does not constitute investment advice. Content should not be construed as personal advice. Seek independent financial advice.
© 2026 Milton Markets. All rights reserved.
TermsPrivacyCookiesRisk