Milton Markets
Markets
Trading
Company
Partners
Sign InOpen Account
  1. Home/
  2. Market Analysis/
  3. Gold Plummets, Focus on Fibonacci Retracements【April 23, 2024】
Koki Ando•Apr 23, 2024

Gold Plummets, Focus on Fibonacci Retracements【April 23, 2024】

Koki Ando headshot

Daily Market Analysis

Koki AndoChief Market Analyst

Expert analysis of today's market movements and trading opportunities

Koki Ando headshot

Daily Market Analysis

Koki AndoChief Market Analyst

Expert analysis of today's market movements and trading opportunities

Fundamental Analysis

  • Iran announces no further retaliation, easing Middle East tensions
  • Chinese gold demand increases, influenced by prolonged real estate and financial instability
  • Chinese central bank also net buys gold, high demand likely to continue

XAUUSD technical analysis

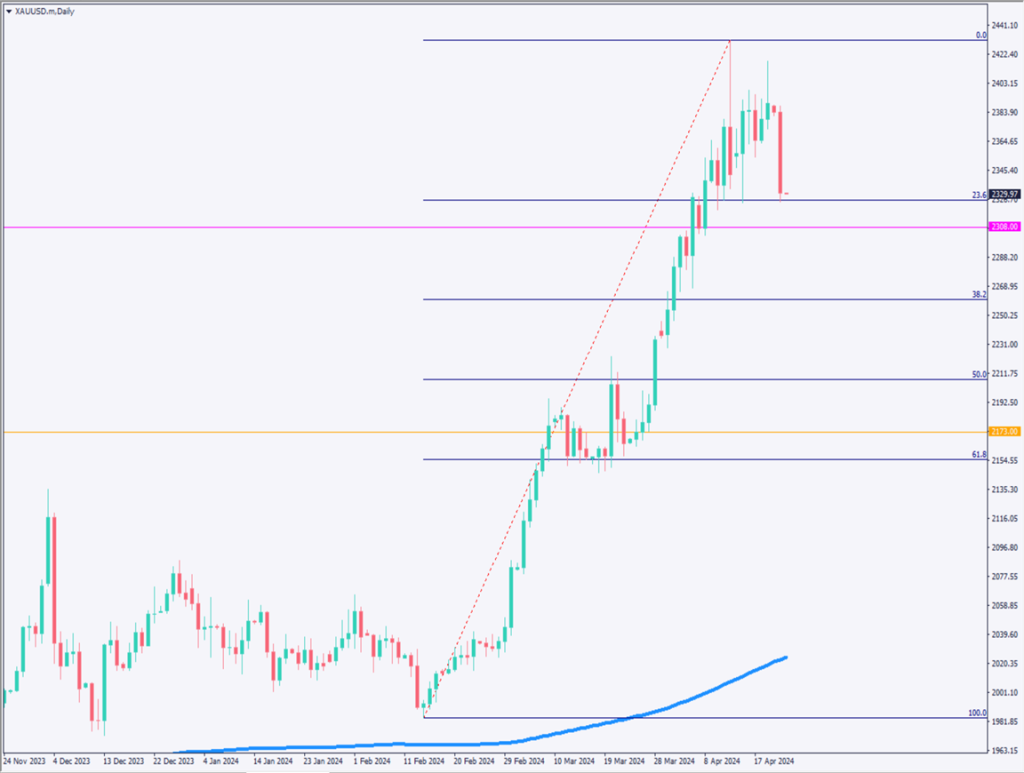
Analyzing the daily chart for gold. After reaching a record high of 2431USD, news of eased tensions in the Middle East triggered profit-taking sales. Drawing Fibonacci retracements shows a decline to the 23.6% level at 2325USD.

Demand for gold as a safe asset has waned, but jewelry demand and Chinese gold buying remain strong, with potential buying opportunities on declines. China has many regulations and limited investment options compared to developed countries. Currently, China’s real estate bubble is collapsing, increasing investments in gold.

Key focus points going forward are whether gold will break below 2325USD or 2308USD. A break below 2300USD could lead to a further drop to around 2250USD.

[XAUUSD/ D1]

Day trading strategy (1 hour)

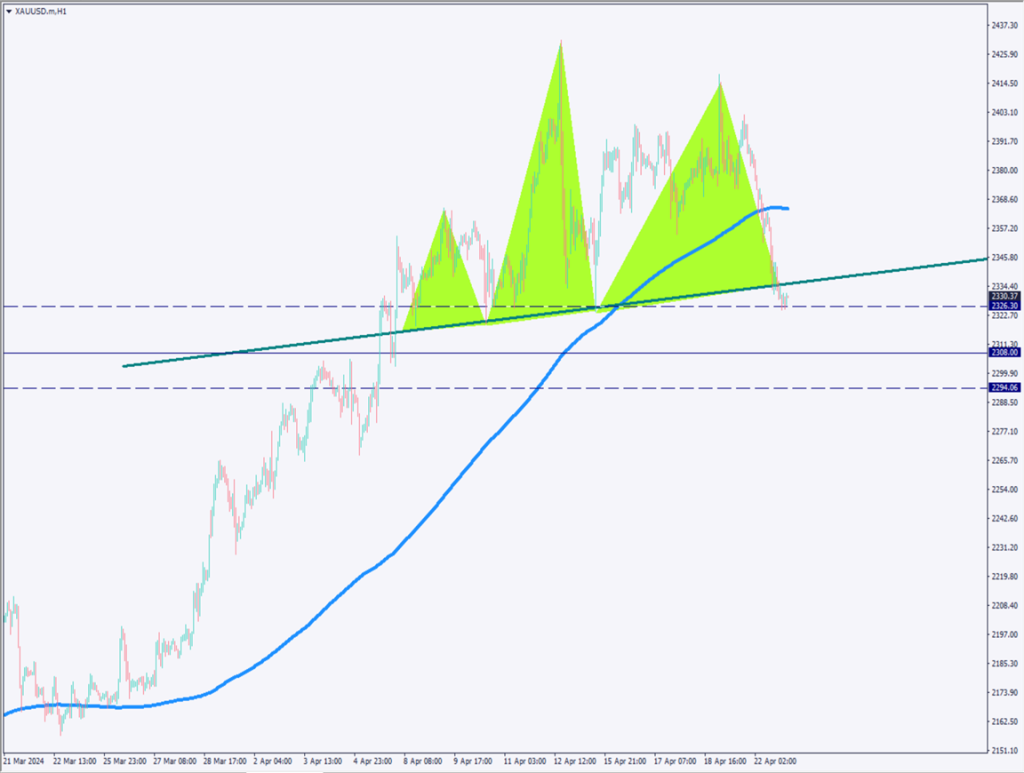
Analyzing the 1-hour chart for gold. Drawing three triangles, one neckline emerges. Currently breaking out of this neckline, which may act as a resistance line.

Breaking below 2325USD leads to a potential drop to 2308USD. 2308USD corresponds to a monthly support line, making it relatively likely to rebound.

If buying pressure is strong and clearly surpasses the neckline, it could rise to 2346USD.

Day trading approach: consider selling around 2350USD, stop at 2355USD, and look to close around 2308USD.

Support/Resistance lines

Key support and resistance lines to consider:

2325USD – Fibonacci 23.6%

2308USD – Monthly support line

2260USD – Fibonacci 38.2%

[XAUUSD/ H1]

Market Sentiment

XAUUSD Sell: 55% Buy: 45%

Featured Currency Pair of the Week (USDCHF)

USD to Swiss Franc is ranging, moving between 0.91USD to 0.9150USD. With an RSI at 62, the momentum has paused, but surpassing 0.9150USD could lead to a rise to 0.9215USD.

0.9150USD is a monthly resistance line, taking time to overcome. No economic indicators related to the Swiss Franc are scheduled for today, suggesting a wait-and-see stance.

Today’s important economic indicators

Economic indicators and eventsJapan time
Nikkei Services PMI9:30
US Manufacturing Purchasing Managers’ Index22:45
New Residential Sales23:00

*Trading advice in this article is not provided by Milton Markets, but by Shu Fujiyasu Jr., a certified technical analyst.

Ready to trade?

Open live account

Related Analysis

No Currency Intervention Conducted; Reports of Additional Tariffs on South Korea

No Currency Intervention Conducted; Reports of Additional Tariffs on South Korea

20 days agoRead more →
Can Gold Renew Its Record High?

Can Gold Renew Its Record High?

10 days agoRead more →
Gold and Silver Continue to Hit Record Highs

Gold and Silver Continue to Hit Record Highs

19 days agoRead more →

This material is for informational purposes only and does not constitute investment advice. Trading leveraged products involves significant risk of loss. Past performance is not indicative of future results.

Share

X

Start trading today

  • Fast execution
  • Competitive spreads
  • 24/7 support
Open live accountView account types
Milton Markets
Twitter/XYouTube

Markets

FOREX
CRYPTO
COMMODITIES
INDICES
STOCKS

Trading

  • Flex Account
  • Smart Account
  • Elite Account
  • MetaTrader 5 (MT5)
  • MetaTrader 4 (MT4)
  • Launch WebTrader
  • Learn Hub
  • Economic Calendar
  • Promotions

Company

  • About Us
  • NDD Technology
  • Customer Protection
  • Execution Conditions
  • Company News
  • Blog
  • Market Analysis

Partners

  • IB Program
  • PAMM Program
  • White Label
  • Investor Login
  • Manager Login

Support

  • Terms of Service
  • Privacy Policy
  • Risk Disclosure
  • Contact Us
  • Help Center
  • My Page Login
Milton Markets is a trading name of Milton Markets Ltd. Milton Markets Ltd. is part of Milton Global and is registered in Saint Lucia (Registration Number: 2023-00166). As part of Milton Global, we adhere to the same high regulatory standards as Milton Global Ltd, which is regulated by the Seychelles Financial Services Authority (FSA) under license SD040.
Risk Warning: CFD trading carries high risk and may not suit all investors. You may lose more than your initial investment. Ensure you understand the risks before trading.
Restrictions: Milton Markets does not provide services to the following countries (not limited to these): United States, Canada, European Union countries, Iran, North Korea, Saint Vincent and the Grenadines, Afghanistan, American Samoa, Belarus, Russia, Burundi, Central African Republic, Congo (Brazzaville), Cuba, Iraq, Lebanon, Liberia, Libya, Myanmar, Puerto Rico, Rwanda, Somalia, Sudan, Syria, US Virgin Islands, Venezuela, Yemen, Zimbabwe, Côte d'Ivoire, Mali, Guinea, Eritrea.
You must be 18 years old or the legal age in your country of residence.
By opening an account, you are considered to have registered of your own volition without solicitation from Milton Markets.
Disclaimer: This website does not constitute investment advice. Content should not be construed as personal advice. Seek independent financial advice.
© 2026 Milton Markets. All rights reserved.
TermsPrivacyCookiesRisk