Milton Markets
Markets
Trading
Company
Partners
Sign InOpen Account
  1. Home/
  2. Market Analysis/
  3. USDJPY Surges to the 158 JPY Range, 160 JPY Range in Sight【April 29, 2024】
Koki Ando•Apr 29, 2024

USDJPY Surges to the 158 JPY Range, 160 JPY Range in Sight【April 29, 2024】

Koki Ando headshot

Daily Market Analysis

Koki AndoChief Market Analyst

Expert analysis of today's market movements and trading opportunities

Koki Ando headshot

Daily Market Analysis

Koki AndoChief Market Analyst

Expert analysis of today's market movements and trading opportunities

Fundamental Analysis

  • The Bank of Japan maintains current monetary policy, interpreted as dovish, accelerating JPY selling
  • USDJPY has surged to the 158 JPY range, with no stop to the weakening JPY and strengthening USD
  • U.S. GDP is slowing, focus on U.S. interest rate policy

USDJPY technical analysis

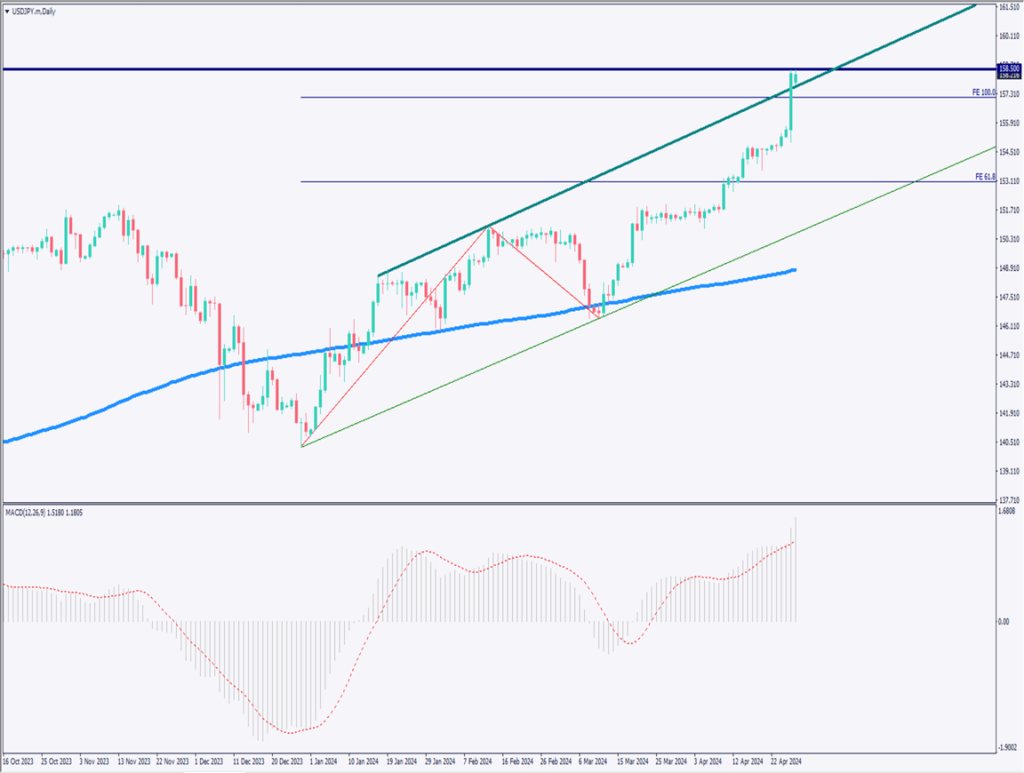
Analyzing the daily chart of USDJPY. According to technical analysis, it has broken out upwards through the rising channel, indicating a somewhat overheated state. The RSI is around 79, high, signaling that a pullback adjustment might be necessary.

As the upper limit price range for April is 158.50 JPY, reaching the 160 JPY range might be postponed until May. With the Golden Week period typically seeing low trading volumes, the likelihood of currency intervention is low, hence, speculators might further sell JPY.

Therefore, during Golden Week, there is a high possibility of increased volatility, and caution is needed against sudden market shifts.

[USDJPY/ D1]

Day trading strategy (1 hour)

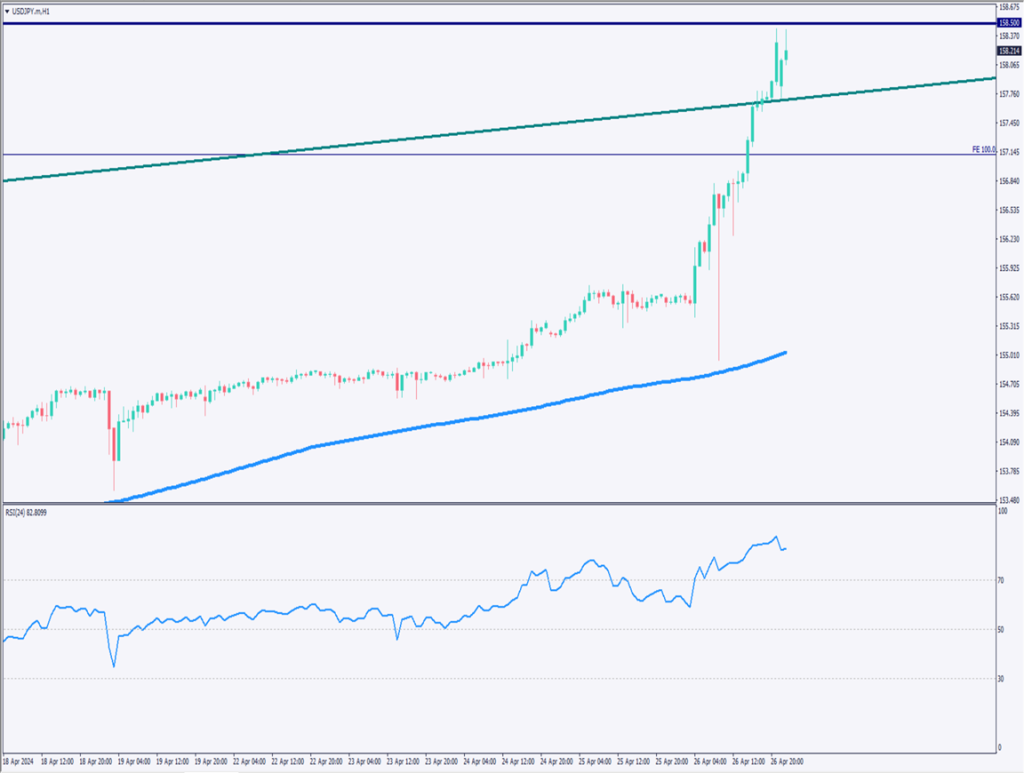
Analyzing the 1-hour chart of USDJPY. RSI is at 82, indicating a significantly overheated market. The appearance of candlesticks with long lower shadows and doji suggests that JPY selling is not stopping.

As long as the Bank of Japan does not hint at a rate hike, the interest rate differential between Japan and the U.S. will remain, thus, a weaker JPY and stronger USD trend is likely to continue. However, due to the overheated market, a corrective sell-off is probable.

Buying on dips is considered a good strategy, but since tomorrow is month-end, it might be better to wait for a deeper adjustment.

As a specific day trading strategy, aim to buy on dips in the early 157 JPY range. Set the entry at 157.15 JPY, the take-profit at 157.75 JPY, and the stop-loss at 156.85 JPY.

Support/Resistance lines

Key support and resistance lines to consider are as follows:

158.50 JPY – Monthly resistance line

[USDJPY/ H1]

Market Sentiment

USDJPY Selling: 85% Buying: 15%

Featured Currency Pair of the Week (EURCHF)

The Euro-Swiss Franc might find resistance at 0.9850 CHF. After rebounding from the 200-day moving average, it is rising again and may try to break 0.9850 CHF once more. It has escaped a long-term downtrend and is now in an uptrend.

Breaking 0.9850 CHF could start to bring the round number of 1.00 into focus.

Today’s important economic indicators

Economic indicators and eventsJapan time
German Consumer Price Index21:00

*Trading advice in this article is not provided by Milton Markets, but by Shu Fujiyasu Jr., a certified technical analyst.

Ready to trade?

Open live account

Related Analysis

No Currency Intervention Conducted; Reports of Additional Tariffs on South Korea

No Currency Intervention Conducted; Reports of Additional Tariffs on South Korea

20 days agoRead more →
USD/JPY: Selling Pressure Dominates on Rallies

USD/JPY: Selling Pressure Dominates on Rallies

6 days agoRead more →
USD/JPY Forms a Range — What’s Next?

USD/JPY Forms a Range — What’s Next?

TodayRead more →

This material is for informational purposes only and does not constitute investment advice. Trading leveraged products involves significant risk of loss. Past performance is not indicative of future results.

Share

X

Start trading today

  • Fast execution
  • Competitive spreads
  • 24/7 support
Open live accountView account types
Milton Markets
Twitter/XYouTube

Markets

FOREX
CRYPTO
COMMODITIES
INDICES
STOCKS

Trading

  • Flex Account
  • Smart Account
  • Elite Account
  • MetaTrader 5 (MT5)
  • MetaTrader 4 (MT4)
  • Launch WebTrader
  • Learn Hub
  • Economic Calendar
  • Promotions

Company

  • About Us
  • NDD Technology
  • Customer Protection
  • Execution Conditions
  • Company News
  • Blog
  • Market Analysis

Partners

  • IB Program
  • PAMM Program
  • White Label
  • Investor Login
  • Manager Login

Support

  • Terms of Service
  • Privacy Policy
  • Risk Disclosure
  • Contact Us
  • Help Center
  • My Page Login
Milton Markets is a trading name of Milton Markets Ltd. Milton Markets Ltd. is part of Milton Global and is registered in Saint Lucia (Registration Number: 2023-00166). As part of Milton Global, we adhere to the same high regulatory standards as Milton Global Ltd, which is regulated by the Seychelles Financial Services Authority (FSA) under license SD040.
Risk Warning: CFD trading carries high risk and may not suit all investors. You may lose more than your initial investment. Ensure you understand the risks before trading.
Restrictions: Milton Markets does not provide services to the following countries (not limited to these): United States, Canada, European Union countries, Iran, North Korea, Saint Vincent and the Grenadines, Afghanistan, American Samoa, Belarus, Russia, Burundi, Central African Republic, Congo (Brazzaville), Cuba, Iraq, Lebanon, Liberia, Libya, Myanmar, Puerto Rico, Rwanda, Somalia, Sudan, Syria, US Virgin Islands, Venezuela, Yemen, Zimbabwe, Côte d'Ivoire, Mali, Guinea, Eritrea.
You must be 18 years old or the legal age in your country of residence.
By opening an account, you are considered to have registered of your own volition without solicitation from Milton Markets.
Disclaimer: This website does not constitute investment advice. Content should not be construed as personal advice. Seek independent financial advice.
© 2026 Milton Markets. All rights reserved.
TermsPrivacyCookiesRisk