Milton Markets
Markets
Trading
Company
Partners
Sign InOpen Account
  1. Home/
  2. Market Analysis/
  3. Gold Falls as Fed Chair Signals Hawkish Shift, USD Demand Increases【May 1, 2024】
Koki Ando•May 1, 2024

Gold Falls as Fed Chair Signals Hawkish Shift, USD Demand Increases【May 1, 2024】

Koki Ando headshot

Daily Market Analysis

Koki AndoChief Market Analyst

Expert analysis of today's market movements and trading opportunities

Koki Ando headshot

Daily Market Analysis

Koki AndoChief Market Analyst

Expert analysis of today's market movements and trading opportunities

Fundamental Analysis

  • Gold declines amidst easing tensions in the Middle East and rising yields on US 10-year Treasuries.
  • Attention on upcoming FOMC meeting; Fed Chair may suggest a hawkish turn.
  • Gold shifts to a downward trend; watch for downside risks.

XAUUSD technical analysis

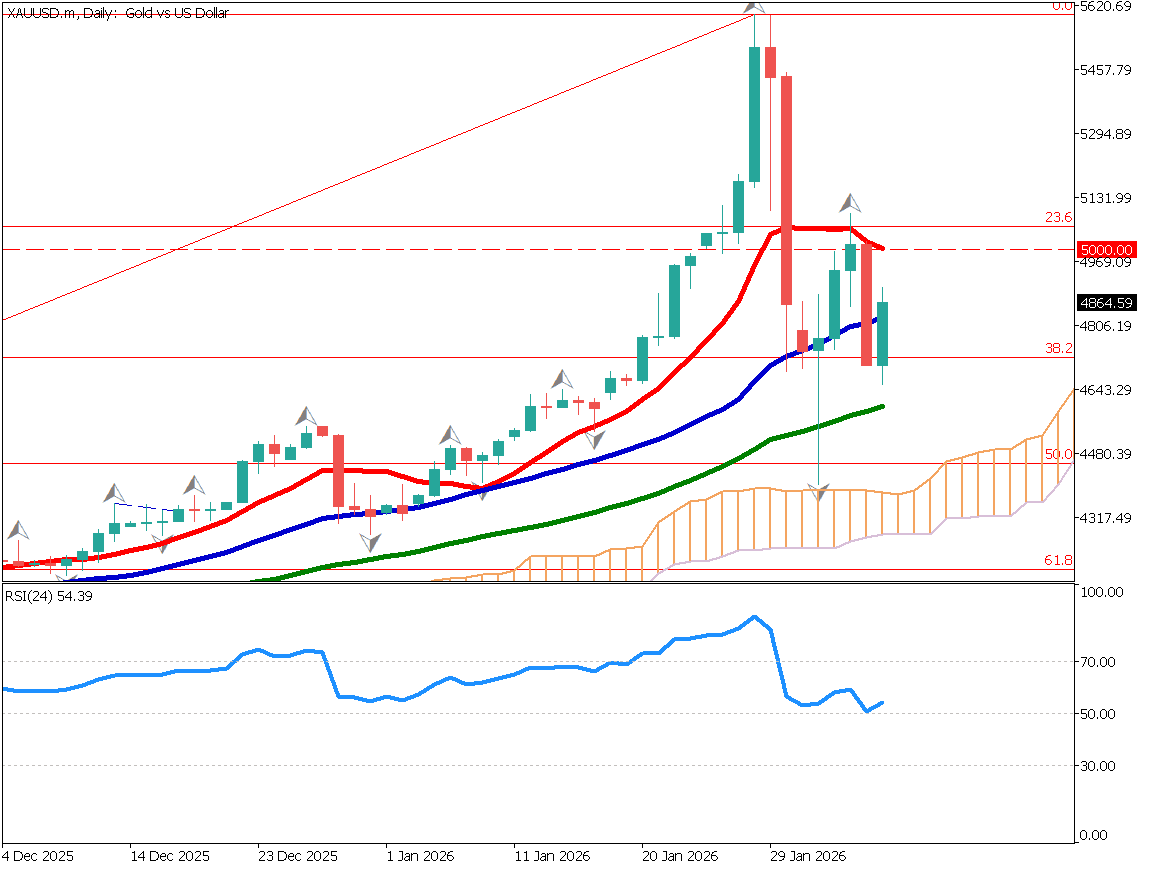
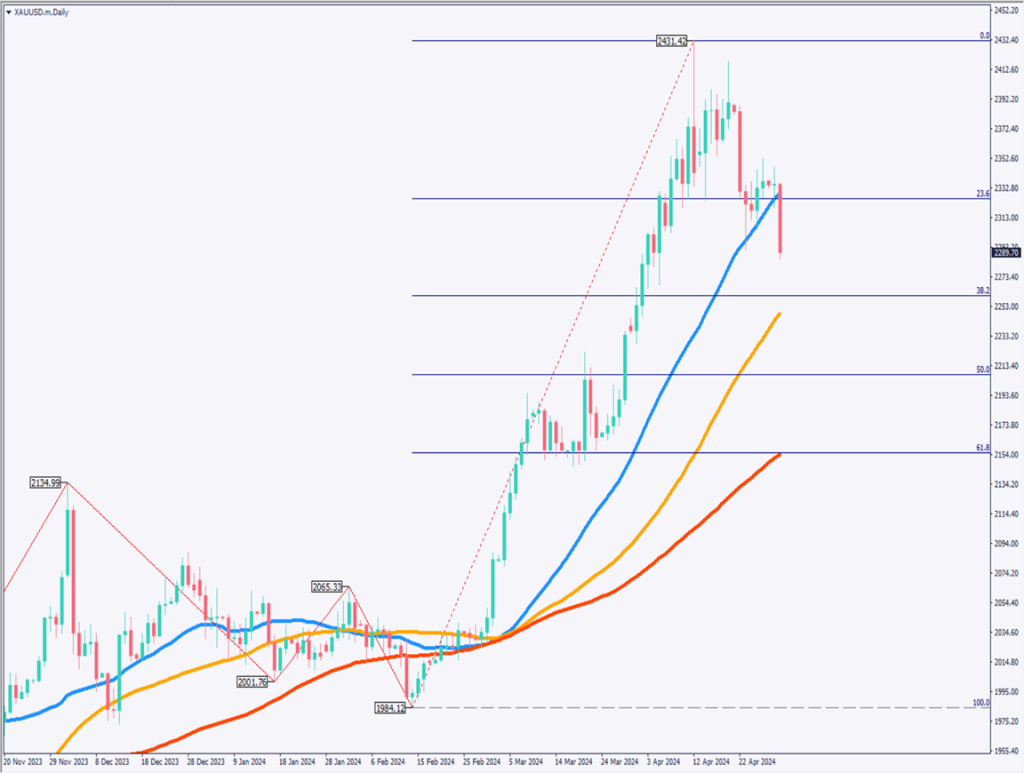
Analysis of the daily gold chart shows a break below the 23.6% Fibonacci retracement level and the 28-day moving average, suggesting a pause in the upward trend that began in February.

Moreover, breaking below the recent low of 2291USD indicates the onset of a downward trend according to Dow theory.

This shift is influenced by rising US employment cost index and persistent high inflation, suggesting that the Fed might turn hawkish.

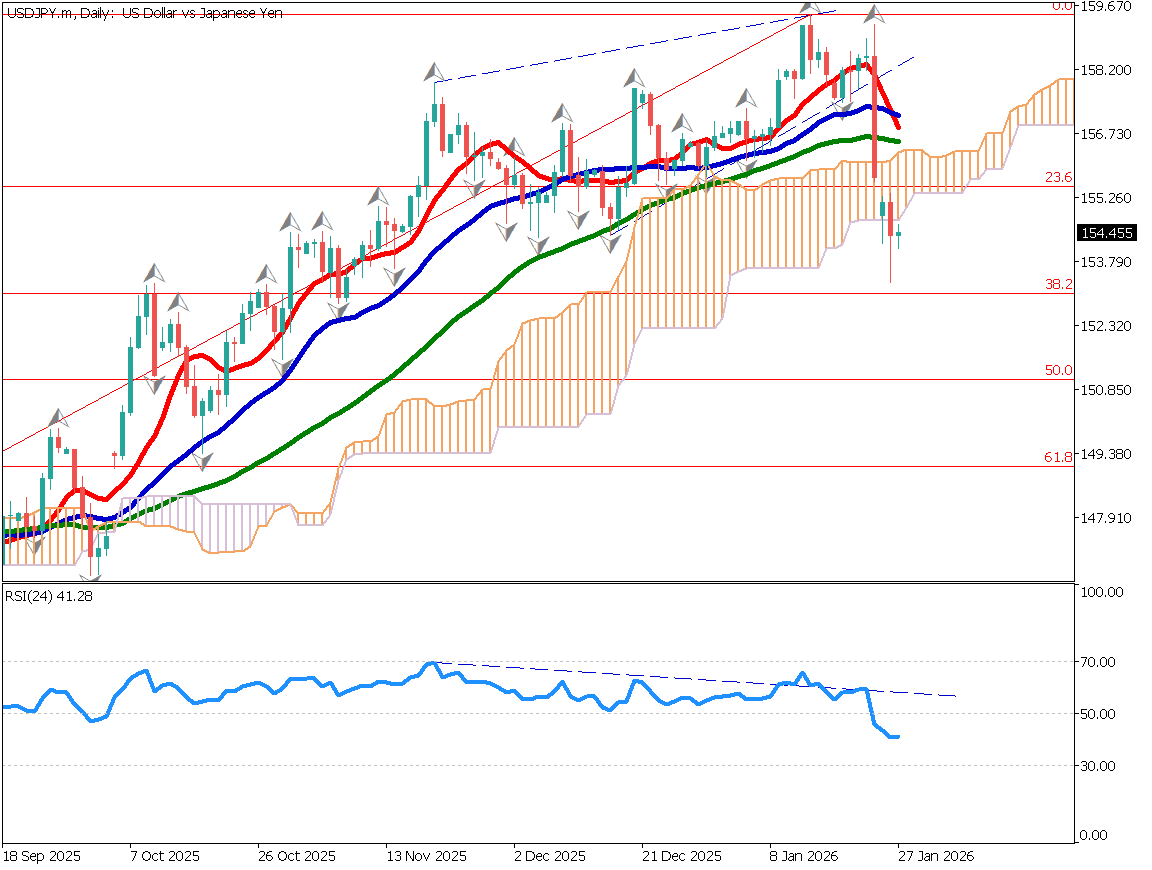
Today’s FOMC session is critical, with Chair Powell’s remarks anticipated. He might express caution against rate cuts and mention the possibility of further rate hikes. If the Fed turns hawkish, gold could face selling pressure, making USD likely to strengthen, thus expecting USDJPY to rise.

[XAUUSD/ D1]

Day trading strategy (1 hour)

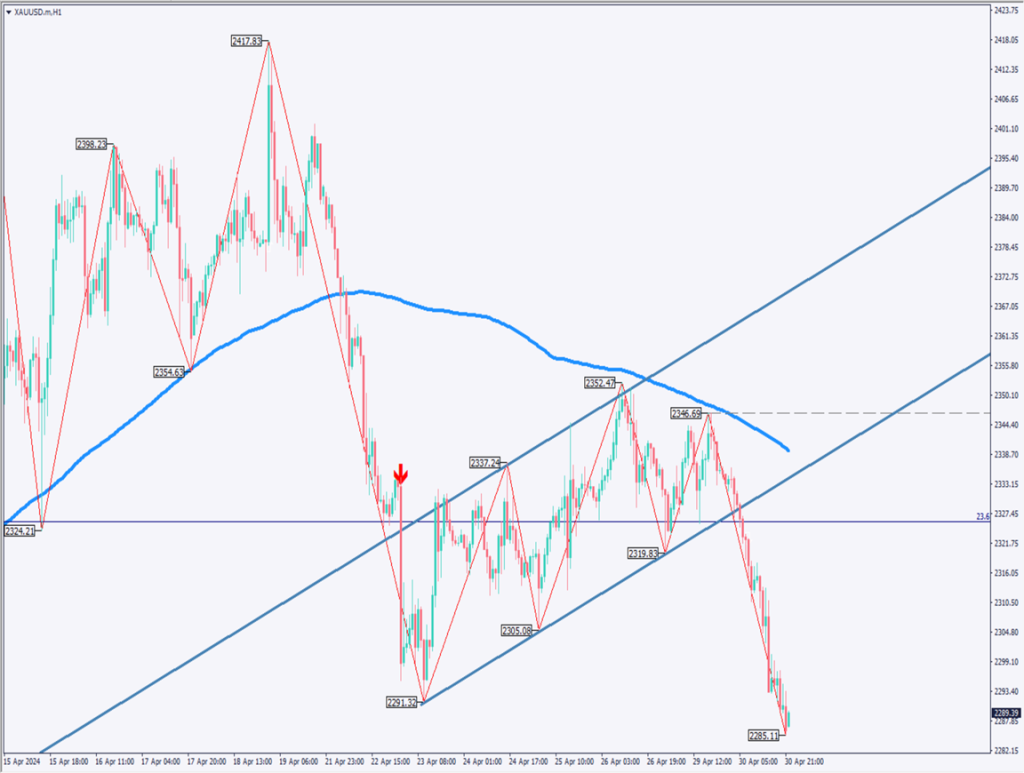
Analysis of the 1-hour chart of gold shows a typical descending flag pattern, with a significant drop due to the breakout of the flag and the daily chart’s 23.6% Fibonacci level.

Considering the ‘N wave,’ the fall from 2417USD to 2291USD and the decline from 2352USD are roughly equal. Based on this, the target for gold could be around 2226USD. However, the 38.2% Fibonacci level at 2260USD and the 52-day moving average at 2248USD suggest a rapid drop is unlikely. A realistic target would be in the 2220USD range.

For day trading, the approach should lean towards selling, setting up a sell on a retrace to 2300USD. Place a stop loss if it exceeds 2305USD, with a target of 2260USD for closing.

Support/Resistance lines

Upcoming important support and resistance lines to consider:

2260USD — 38.2% Fibonacci

[XAUUSD/ H1]

Market Sentiment

XAUUSD Sell: 47%, Buy: 53%

Featured Currency Pair of the Week (EURCHF)

EURCHF is on the rise. A weekly chart pattern of ‘bearish + hammer + bullish’ candles suggests an uptrend. It has risen to the 0.98CHF range, focusing on whether it can surpass the recent high of 0.985CHF.

If it exceeds 0.985CHF, the 61.8% Fibonacci expansion level of 0.990CHF would be the next resistance. The rise is supported by the 28-day moving average. Watch for updates to recent highs.

Today’s important economic indicators

Economic indicators and eventsJapan time
Germany & UK Holiday–
US ADP Employment Report21:15
US FOMC & Interest Rate DecisionNext 3:00
Fed Chair Press ConferenceNext 3:30

*Trading advice in this article is not provided by Milton Markets, but by Shu Fujiyasu Jr., a certified technical analyst.

Ready to trade?

Open live account

Related Analysis

Can Gold Renew Its Record High?

Can Gold Renew Its Record High?

10 days agoRead more →
Gold and Silver Continue to Hit Record Highs

Gold and Silver Continue to Hit Record Highs

19 days agoRead more →
No Currency Intervention Conducted; Reports of Additional Tariffs on South Korea

No Currency Intervention Conducted; Reports of Additional Tariffs on South Korea

20 days agoRead more →

This material is for informational purposes only and does not constitute investment advice. Trading leveraged products involves significant risk of loss. Past performance is not indicative of future results.

Share

X

Start trading today

  • Fast execution
  • Competitive spreads
  • 24/7 support
Open live accountView account types
Milton Markets
Twitter/XYouTube

Markets

FOREX
CRYPTO
COMMODITIES
INDICES
STOCKS

Trading

  • Flex Account
  • Smart Account
  • Elite Account
  • MetaTrader 5 (MT5)
  • MetaTrader 4 (MT4)
  • Launch WebTrader
  • Learn Hub
  • Economic Calendar
  • Promotions

Company

  • About Us
  • NDD Technology
  • Customer Protection
  • Execution Conditions
  • Company News
  • Blog
  • Market Analysis

Partners

  • IB Program
  • PAMM Program
  • White Label
  • Investor Login
  • Manager Login

Support

  • Terms of Service
  • Privacy Policy
  • Risk Disclosure
  • Contact Us
  • Help Center
  • My Page Login
Milton Markets is a trading name of Milton Markets Ltd. Milton Markets Ltd. is part of Milton Global and is registered in Saint Lucia (Registration Number: 2023-00166). As part of Milton Global, we adhere to the same high regulatory standards as Milton Global Ltd, which is regulated by the Seychelles Financial Services Authority (FSA) under license SD040.
Risk Warning: CFD trading carries high risk and may not suit all investors. You may lose more than your initial investment. Ensure you understand the risks before trading.
Restrictions: Milton Markets does not provide services to the following countries (not limited to these): United States, Canada, European Union countries, Iran, North Korea, Saint Vincent and the Grenadines, Afghanistan, American Samoa, Belarus, Russia, Burundi, Central African Republic, Congo (Brazzaville), Cuba, Iraq, Lebanon, Liberia, Libya, Myanmar, Puerto Rico, Rwanda, Somalia, Sudan, Syria, US Virgin Islands, Venezuela, Yemen, Zimbabwe, Côte d'Ivoire, Mali, Guinea, Eritrea.
You must be 18 years old or the legal age in your country of residence.
By opening an account, you are considered to have registered of your own volition without solicitation from Milton Markets.
Disclaimer: This website does not constitute investment advice. Content should not be construed as personal advice. Seek independent financial advice.
© 2026 Milton Markets. All rights reserved.
TermsPrivacyCookiesRisk