Milton Markets
Markets
Trading
Company
Partners
Sign InOpen Account
  1. Home/
  2. Market Analysis/
  3. USDJPY Continues Weakening Yen Trend, Surprising Hawkishness Within the Bank of Japan?【May 9, 2024】
Koki Ando•May 9, 2024

USDJPY Continues Weakening Yen Trend, Surprising Hawkishness Within the Bank of Japan?【May 9, 2024】

Koki Ando headshot

Daily Market Analysis

Koki AndoChief Market Analyst

Expert analysis of today's market movements and trading opportunities

Koki Ando headshot

Daily Market Analysis

Koki AndoChief Market Analyst

Expert analysis of today's market movements and trading opportunities

Fundamental Analysis

  • A primary opinion within the Bank of Japan states, “If price increases continue, a rate hike is quite possible.”
  • USDJPY has recovered from a weakening yen trend with a low at 151.85JPY and a high at 155.68JPY

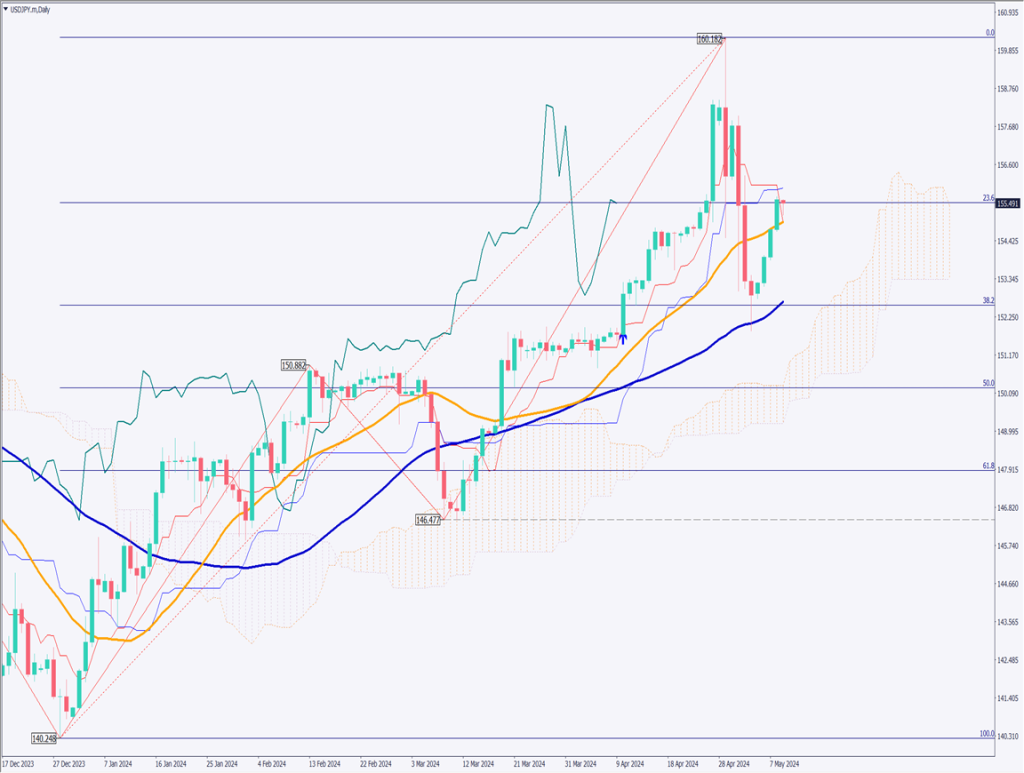
USDJPY technical analysis

Analyzing the daily chart for USDJPY, which has risen for four consecutive days. The Fibonacci retracement is being observed, with ongoing battles around the 23.6% level. Breaking above the Ichimoku Cloud’s Conversion Line, with the Base Line acting as resistance.

The 23.6% corresponds to 155.50JPY, and breaking above this level could aim for 160JPY again, requiring vigilance.

It has also been revealed that there were hawkish views within the Bank of Japan. Although this won’t reverse the weakening yen trend, the market’s focus is likely to intensify on the progression of Japan’s Consumer Price Index.

[USDJPY/ D1]

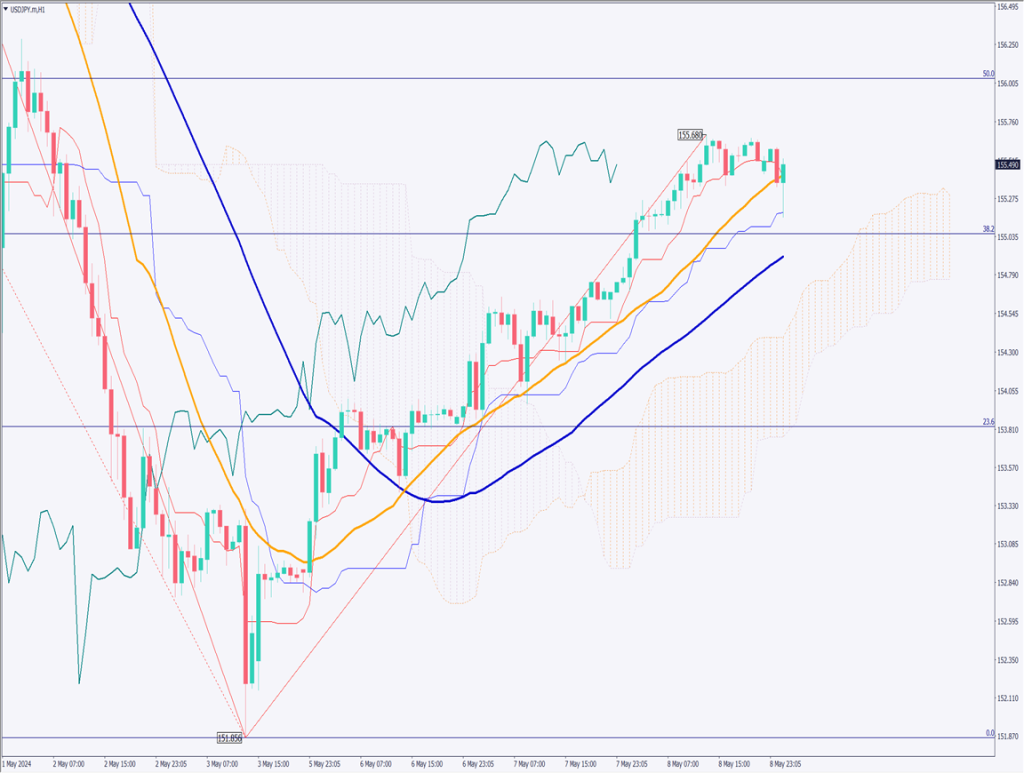
Day trading strategy (1 hour)

Analyzing the 1-hour chart for USDJPY, where the 24-hour moving average serves as support. A rebound at the Ichimoku Cloud’s Base Line is observed, indicating a strong desire to buy on dips, with the weakening yen trend expected to continue.

The 50% Fibonacci retracement on the 1-hour chart is near 156JPY. Today, 156JPY might become the high.

Day trading policy is to buy on dips. Consider buying around 155.30JPY. Settle at 156JPY and stop if it falls below 155JPY.

Support/Resistance lines

Future important support and resistance lines are as follows:

156.00JPY – 1-hour chart Fibonacci 50%
155.05JPY – 1-hour chart Fibonacci 38.2%

[USDJPY/ H1]

Market Sentiment

USDJPY Sell: 76% Buy: 24%

Featured Currency Pair of the Week (EURAUD)

EUR/AUD has risen for three consecutive days. The focus is whether the Conversion Line of the Ichimoku Cloud will act as resistance. In the weekly chart, it is moving within the cloud, indicating unstable movements, with surprisingly strong buying of the euro. Keep an eye on movements near the Conversion Line.

Today’s important economic indicators

Economic indicators and eventsJapan time
UK Interest Rate Announcement20:00
Statement from the Governor of the Bank of England20:30
U.S. Unemployment Insurance Claims21:30

*Trading advice in this article is not provided by Milton Markets, but by Shu Fujiyasu Jr., a certified technical analyst.

Ready to trade?

Open live account

Related Analysis

USD/JPY dips slightly on LDP landslide victory

USD/JPY dips slightly on LDP landslide victory

7 days agoRead more →
No Currency Intervention Conducted; Reports of Additional Tariffs on South Korea

No Currency Intervention Conducted; Reports of Additional Tariffs on South Korea

20 days agoRead more →
USD/JPY: Selling Pressure Dominates on Rallies

USD/JPY: Selling Pressure Dominates on Rallies

6 days agoRead more →

This material is for informational purposes only and does not constitute investment advice. Trading leveraged products involves significant risk of loss. Past performance is not indicative of future results.

Share

X

Start trading today

  • Fast execution
  • Competitive spreads
  • 24/7 support
Open live accountView account types
Milton Markets
Twitter/XYouTube

Markets

FOREX
CRYPTO
COMMODITIES
INDICES
STOCKS

Trading

  • Flex Account
  • Smart Account
  • Elite Account
  • MetaTrader 5 (MT5)
  • MetaTrader 4 (MT4)
  • Launch WebTrader
  • Learn Hub
  • Economic Calendar
  • Promotions

Company

  • About Us
  • NDD Technology
  • Customer Protection
  • Execution Conditions
  • Company News
  • Blog
  • Market Analysis

Partners

  • IB Program
  • PAMM Program
  • White Label
  • Investor Login
  • Manager Login

Support

  • Terms of Service
  • Privacy Policy
  • Risk Disclosure
  • Contact Us
  • Help Center
  • My Page Login
Milton Markets is a trading name of Milton Markets Ltd. Milton Markets Ltd. is part of Milton Global and is registered in Saint Lucia (Registration Number: 2023-00166). As part of Milton Global, we adhere to the same high regulatory standards as Milton Global Ltd, which is regulated by the Seychelles Financial Services Authority (FSA) under license SD040.
Risk Warning: CFD trading carries high risk and may not suit all investors. You may lose more than your initial investment. Ensure you understand the risks before trading.
Restrictions: Milton Markets does not provide services to the following countries (not limited to these): United States, Canada, European Union countries, Iran, North Korea, Saint Vincent and the Grenadines, Afghanistan, American Samoa, Belarus, Russia, Burundi, Central African Republic, Congo (Brazzaville), Cuba, Iraq, Lebanon, Liberia, Libya, Myanmar, Puerto Rico, Rwanda, Somalia, Sudan, Syria, US Virgin Islands, Venezuela, Yemen, Zimbabwe, Côte d'Ivoire, Mali, Guinea, Eritrea.
You must be 18 years old or the legal age in your country of residence.
By opening an account, you are considered to have registered of your own volition without solicitation from Milton Markets.
Disclaimer: This website does not constitute investment advice. Content should not be construed as personal advice. Seek independent financial advice.
© 2026 Milton Markets. All rights reserved.
TermsPrivacyCookiesRisk