Milton Markets
Markets
Trading
Company
Partners
Sign InOpen Account
  1. Home/
  2. Market Analysis/
  3. Gold Rises as US Economic Indicators Weaken, Boosting Rate Cut Expectations【May 16, 2024】
Koki Ando•May 16, 2024

Gold Rises as US Economic Indicators Weaken, Boosting Rate Cut Expectations【May 16, 2024】

Koki Ando headshot

Daily Market Analysis

Koki AndoChief Market Analyst

Expert analysis of today's market movements and trading opportunities

Koki Ando headshot

Daily Market Analysis

Koki AndoChief Market Analyst

Expert analysis of today's market movements and trading opportunities

Fundamental Analysis

  • US CPI and US Retail Sales Show Weak Results
  • US Consumer Price Index Slows to a Six-Month Low
  • US FOMC Officials Comment on Persistent Rate Policy

XAUUSD technical analysis

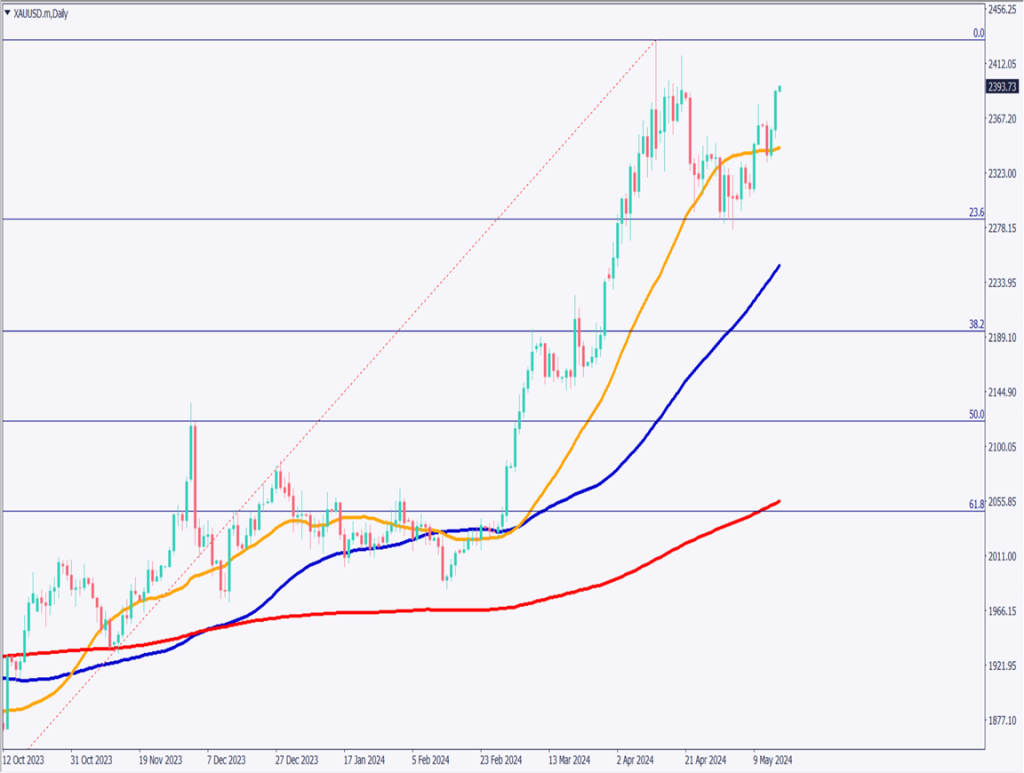
Analyzing the daily chart of gold. With the weak US CPI results and lower-than-expected retail sales, the view that inflation and the economy are being restrained has become dominant. After the CPI announcement, rate cut expectations increased, and gold rose to around 2393 USD, with 2400 USD now in sight.

The 28-day moving average is functioning as a support line, and gold continues to rise, aiming to update the recent highs. The all-time high is around 2430 USD, and if surpassed, it may aim for 2500 USD. If rate cut expectations increase, gold may become easier to buy, accelerating its rise.

[XAUUSD/ D1]

Day trading strategy (1 hour)

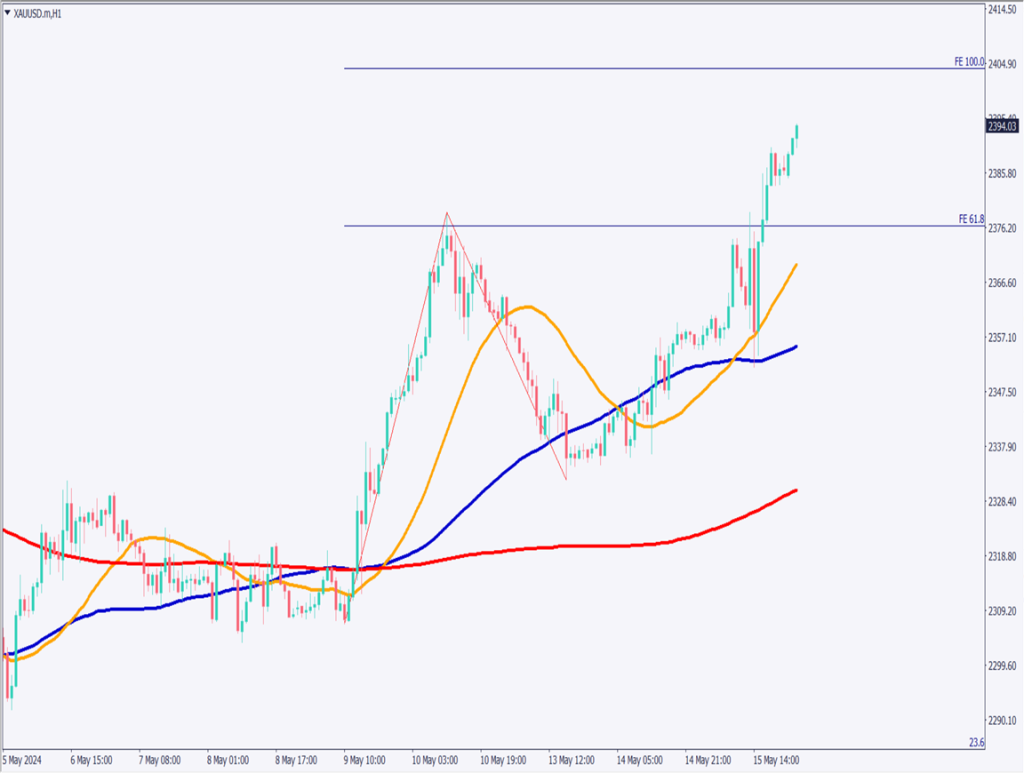
Analyzing the hourly chart of gold. Drawing the Fibonacci expansion, gold rebounded at 61.8% of 2377 USD and rose to around 2393 USD. It may aim to rise to around 2404 USD, which corresponds to 100%.

Due to weak US economic indicators, rate cut expectations increased, which supports gold’s rise. Therefore, the day trading policy is to buy. Specifically, buy in the 2380 USD range, close around 2400 USD, and set a stop if it falls below 2375 USD.

Support/Resistance lines

The support and resistance lines to consider going forward are as follows:

2404 USD: 100% of the Fibonacci expansion

[XAUUSD/ H1]

Market Sentiment

XAUUSD: Sell: 59%, Buy: 41%

Featured Currency Pair of the Week (AUDNZD)

AUDNZD stopped declining at 61.8% of the daily Fibonacci retracement. It can be judged that the downward trend is strengthening as it fell below the 28-day moving average. Although it rebounded at 1.09 NZD, it may test this level again.

The pair has already broken below recent lows, indicating a downward trend. If trading, consider entries in the downward direction.

Today’s important economic indicators

Economic indicators and eventsJapan time
Japan GDP8:50
Australia Employment Statistics10:30
US Jobless Claims21:30
FOMC Member Speech23:30
FOMC Member Speech0:30 the next day

*Trading advice in this article is not provided by Milton Markets, but by Shu Fujiyasu Jr., a certified technical analyst.

Ready to trade?

Open live account

Related Analysis

Gold and Silver Continue to Hit Record Highs

Gold and Silver Continue to Hit Record Highs

19 days agoRead more →
Can Gold Renew Its Record High?

Can Gold Renew Its Record High?

10 days agoRead more →
USD/JPY dips slightly on LDP landslide victory

USD/JPY dips slightly on LDP landslide victory

7 days agoRead more →

This material is for informational purposes only and does not constitute investment advice. Trading leveraged products involves significant risk of loss. Past performance is not indicative of future results.

Share

X

Start trading today

  • Fast execution
  • Competitive spreads
  • 24/7 support
Open live accountView account types
Milton Markets
Twitter/XYouTube

Markets

FOREX
CRYPTO
COMMODITIES
INDICES
STOCKS

Trading

  • Flex Account
  • Smart Account
  • Elite Account
  • MetaTrader 5 (MT5)
  • MetaTrader 4 (MT4)
  • Launch WebTrader
  • Learn Hub
  • Economic Calendar
  • Promotions

Company

  • About Us
  • NDD Technology
  • Customer Protection
  • Execution Conditions
  • Company News
  • Blog
  • Market Analysis

Partners

  • IB Program
  • PAMM Program
  • White Label
  • Investor Login
  • Manager Login

Support

  • Terms of Service
  • Privacy Policy
  • Risk Disclosure
  • Contact Us
  • Help Center
  • My Page Login
Milton Markets is a trading name of Milton Markets Ltd. Milton Markets Ltd. is part of Milton Global and is registered in Saint Lucia (Registration Number: 2023-00166). As part of Milton Global, we adhere to the same high regulatory standards as Milton Global Ltd, which is regulated by the Seychelles Financial Services Authority (FSA) under license SD040.
Risk Warning: CFD trading carries high risk and may not suit all investors. You may lose more than your initial investment. Ensure you understand the risks before trading.
Restrictions: Milton Markets does not provide services to the following countries (not limited to these): United States, Canada, European Union countries, Iran, North Korea, Saint Vincent and the Grenadines, Afghanistan, American Samoa, Belarus, Russia, Burundi, Central African Republic, Congo (Brazzaville), Cuba, Iraq, Lebanon, Liberia, Libya, Myanmar, Puerto Rico, Rwanda, Somalia, Sudan, Syria, US Virgin Islands, Venezuela, Yemen, Zimbabwe, Côte d'Ivoire, Mali, Guinea, Eritrea.
You must be 18 years old or the legal age in your country of residence.
By opening an account, you are considered to have registered of your own volition without solicitation from Milton Markets.
Disclaimer: This website does not constitute investment advice. Content should not be construed as personal advice. Seek independent financial advice.
© 2026 Milton Markets. All rights reserved.
TermsPrivacyCookiesRisk