Milton Markets
Markets
Trading
Company
Partners
Sign InOpen Account
  1. Home/
  2. Market Analysis/
  3. USDJPY Sees Short-Covering as US Unemployment Claims Fall Below Expectations【May 17, 2024】
Koki Ando•May 17, 2024

USDJPY Sees Short-Covering as US Unemployment Claims Fall Below Expectations【May 17, 2024】

Koki Ando headshot

Daily Market Analysis

Koki AndoChief Market Analyst

Expert analysis of today's market movements and trading opportunities

Koki Ando headshot

Daily Market Analysis

Koki AndoChief Market Analyst

Expert analysis of today's market movements and trading opportunities

Fundamental Analysis

  • US unemployment claims fell 10,000 below expectations, boosting USD buying.
  • USDJPY dropped to the 153 JPY level but rebounded to the 155 JPY level due to short-covering.
  • US financial officials suggest high interest rates might persist longer than expected.

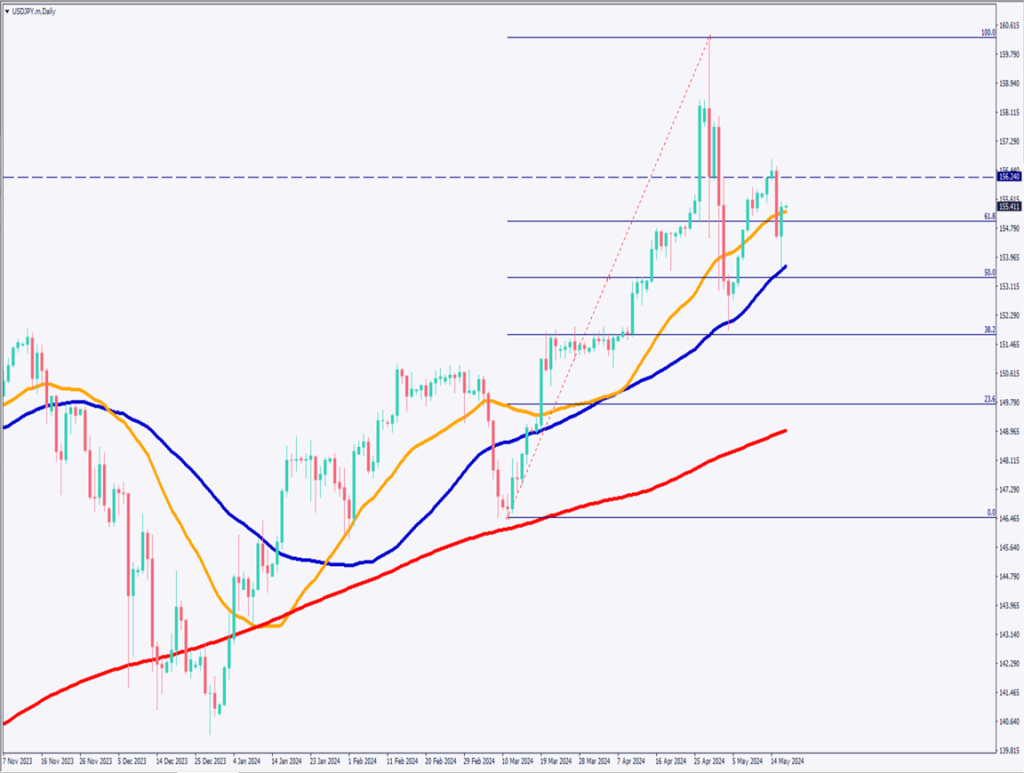
USDJPY technical analysis

Analyzing the USDJPY daily chart: after breaking below the 28-day moving average, it rebounded at the 52-day moving average and the 50% Fibonacci retracement level.

Technically, there is a possibility of shifting from an upward to a downward trend.

Considering the case in 2022 when the exchange rate intervention caused a drop from the 151 JPY level to the 129 JPY level, a sharp JPY appreciation is possible this time as well.

However, with continued USD buying due to the decline in US unemployment claims and employment recovery, JPY appreciation is unlikely unless the Japan-US interest rate differential narrows.

[USDJPY/ D1]

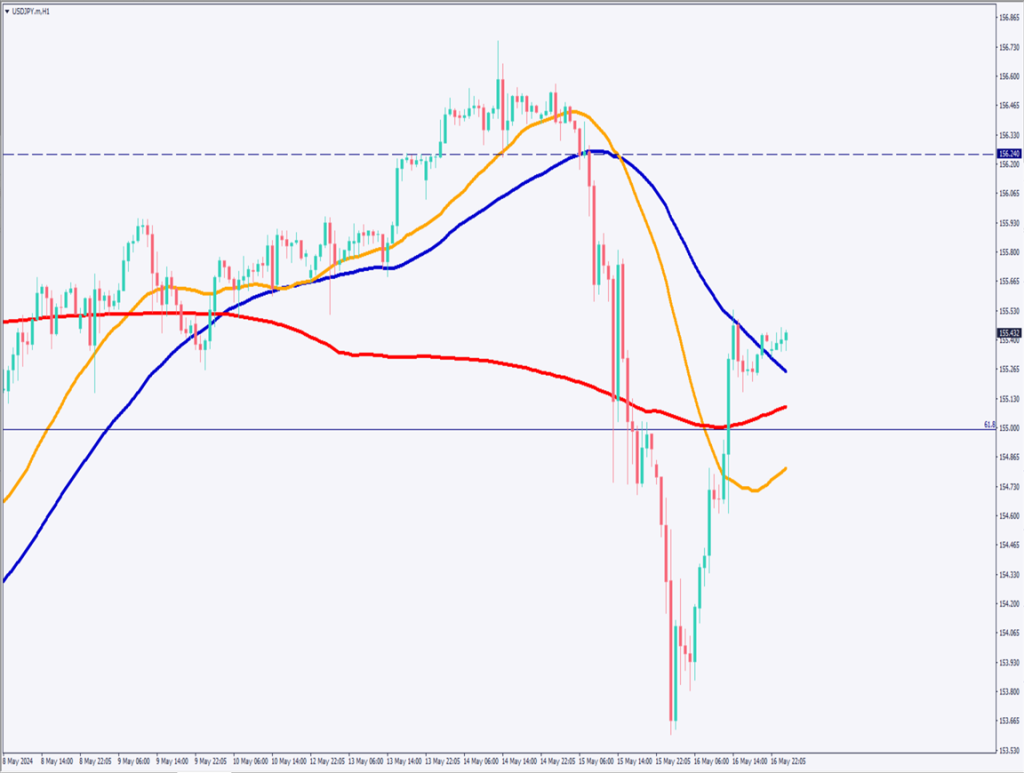
Day trading strategy (1 hour)

Analyzing the USDJPY 1-hour chart: after plummeting from the 156 JPY level to the 153 JPY level, it has recovered to the 155 JPY level. Currently, it is trading above 155.50 JPY, with significant volatility.

In this situation, there is a possibility of aiming for the 156 JPY level again due to short-covering.

For day trading, a buy-on-dip strategy is recommended. Take a buy position if it drops to the lower 155 JPY level, set the target take-profit price at 156 JPY, and for risk management, set the stop-loss at 154.90 JPY.

Support/Resistance lines

The support and resistance lines to consider going forward are as follows:

156.25 JPY: Monthly resistance line

[USDJPY/ H1]

Market Sentiment

USDJPY Sell: 65%, Buy: 35%

Featured Currency Pair of the Week (AUDNZD)

The AUDNZD has declined for three consecutive days. It has broken below the 52-day moving average and is trading around 1.09 NZD. The 1.09 NZD level is also a monthly support line, so a rebound is expected.

The price of 1.087 NZD corresponds to the 50% Fibonacci retracement level, and a rebound is also expected here.
While being cautious of the rebound, it is a situation where we want to aim for selling on rallies. Around 1.093 NZD, we want to consider whether we can try selling on a rally.

Today’s important economic indicators

Economic indicators and eventsJapan time
ECB Vice President Speech16:20
Bank of England Official Speech17:00
EU Consumer Price Index18:00
US Leading Index23:00
Federal Reserve Official Speech23:15

*Trading advice in this article is not provided by Milton Markets, but by Shu Fujiyasu Jr., a certified technical analyst.

Ready to trade?

Open live account

Related Analysis

USD/JPY dips slightly on LDP landslide victory

USD/JPY dips slightly on LDP landslide victory

7 days agoRead more →
USD/JPY Forms a Range — What’s Next?

USD/JPY Forms a Range — What’s Next?

TodayRead more →
No Currency Intervention Conducted; Reports of Additional Tariffs on South Korea

No Currency Intervention Conducted; Reports of Additional Tariffs on South Korea

20 days agoRead more →

This material is for informational purposes only and does not constitute investment advice. Trading leveraged products involves significant risk of loss. Past performance is not indicative of future results.

Share

X

Start trading today

  • Fast execution
  • Competitive spreads
  • 24/7 support
Open live accountView account types
Milton Markets
Twitter/XYouTube

Markets

FOREX
CRYPTO
COMMODITIES
INDICES
STOCKS

Trading

  • Flex Account
  • Smart Account
  • Elite Account
  • MetaTrader 5 (MT5)
  • MetaTrader 4 (MT4)
  • Launch WebTrader
  • Learn Hub
  • Economic Calendar
  • Promotions

Company

  • About Us
  • NDD Technology
  • Customer Protection
  • Execution Conditions
  • Company News
  • Blog
  • Market Analysis

Partners

  • IB Program
  • PAMM Program
  • White Label
  • Investor Login
  • Manager Login

Support

  • Terms of Service
  • Privacy Policy
  • Risk Disclosure
  • Contact Us
  • Help Center
  • My Page Login
Milton Markets is a trading name of Milton Markets Ltd. Milton Markets Ltd. is part of Milton Global and is registered in Saint Lucia (Registration Number: 2023-00166). As part of Milton Global, we adhere to the same high regulatory standards as Milton Global Ltd, which is regulated by the Seychelles Financial Services Authority (FSA) under license SD040.
Risk Warning: CFD trading carries high risk and may not suit all investors. You may lose more than your initial investment. Ensure you understand the risks before trading.
Restrictions: Milton Markets does not provide services to the following countries (not limited to these): United States, Canada, European Union countries, Iran, North Korea, Saint Vincent and the Grenadines, Afghanistan, American Samoa, Belarus, Russia, Burundi, Central African Republic, Congo (Brazzaville), Cuba, Iraq, Lebanon, Liberia, Libya, Myanmar, Puerto Rico, Rwanda, Somalia, Sudan, Syria, US Virgin Islands, Venezuela, Yemen, Zimbabwe, Côte d'Ivoire, Mali, Guinea, Eritrea.
You must be 18 years old or the legal age in your country of residence.
By opening an account, you are considered to have registered of your own volition without solicitation from Milton Markets.
Disclaimer: This website does not constitute investment advice. Content should not be construed as personal advice. Seek independent financial advice.
© 2026 Milton Markets. All rights reserved.
TermsPrivacyCookiesRisk