Milton Markets
Markets
Trading
Company
Partners
Sign InOpen Account
  1. Home/
  2. Market Analysis/
  3. Gold Retreats as US Long-Term Yields Rise for Two Days【May 30, 2024】
Koki Ando•May 30, 2024

Gold Retreats as US Long-Term Yields Rise for Two Days【May 30, 2024】

Koki Ando headshot

Daily Market Analysis

Koki AndoChief Market Analyst

Expert analysis of today's market movements and trading opportunities

Koki Ando headshot

Daily Market Analysis

Koki AndoChief Market Analyst

Expert analysis of today's market movements and trading opportunities

Fundamental Analysis

  • US long-term yields have risen for two consecutive days, with US officials commenting that a rate hike cannot be ruled out.
  • Gold is in a correction phase, breaking below the upward trendline.
  • The overall strength of the USD is exerting selling pressure on gold.

XAUUSD technical analysis

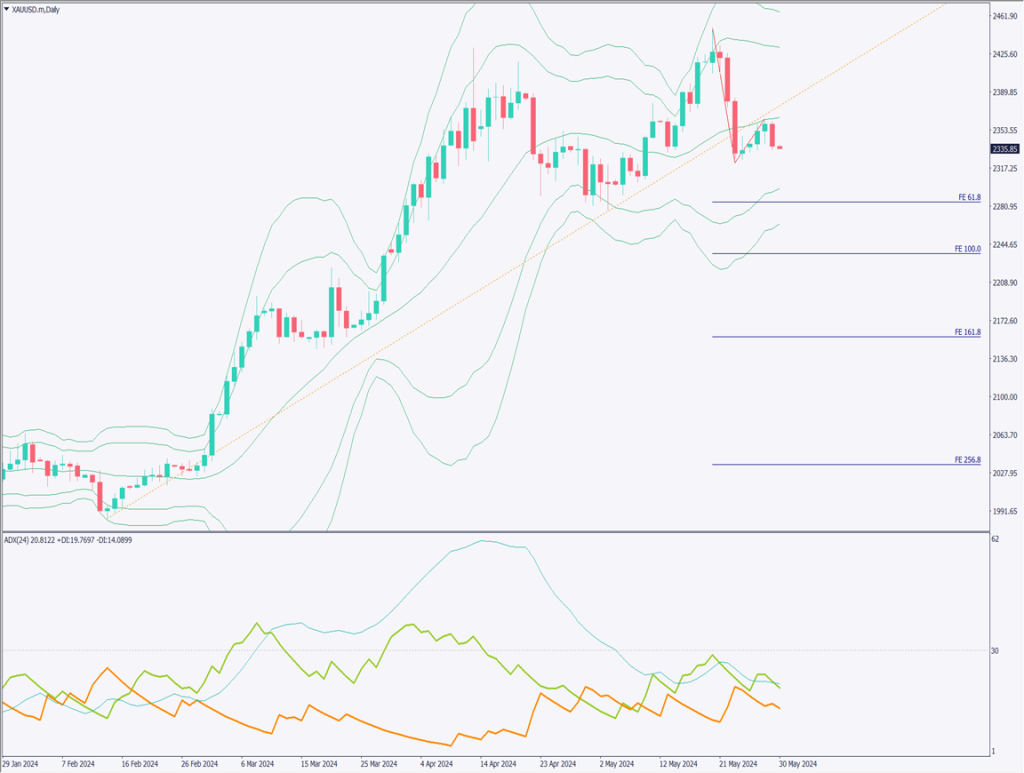
Analyzing the daily chart of gold, it can be confirmed that gold has broken out of the upward trendline. What should be considered is the “N pattern.” After three consecutive large bearish candles, a small bullish candle appears for four days, followed by another slightly larger bearish candle. This can be considered a “three black crows” candlestick pattern. It suggests that gold is in a downward phase.

Drawing the Fibonacci expansion, 61.8% corresponds to 2286 USD, and 100% corresponds to 2240 USD. Currently, gold is trading around 2335 USD, indicating there is room for a 100 USD decline.

Focusing on the fundamentals, US officials have commented on the possibility of additional rate hikes, and US long-term yields have risen for two consecutive days, maintaining a strong USD trend. For now, we should keep an eye on gold with a bearish perspective.

[XAUUSD/ D1]

Day trading strategy (1 hour)

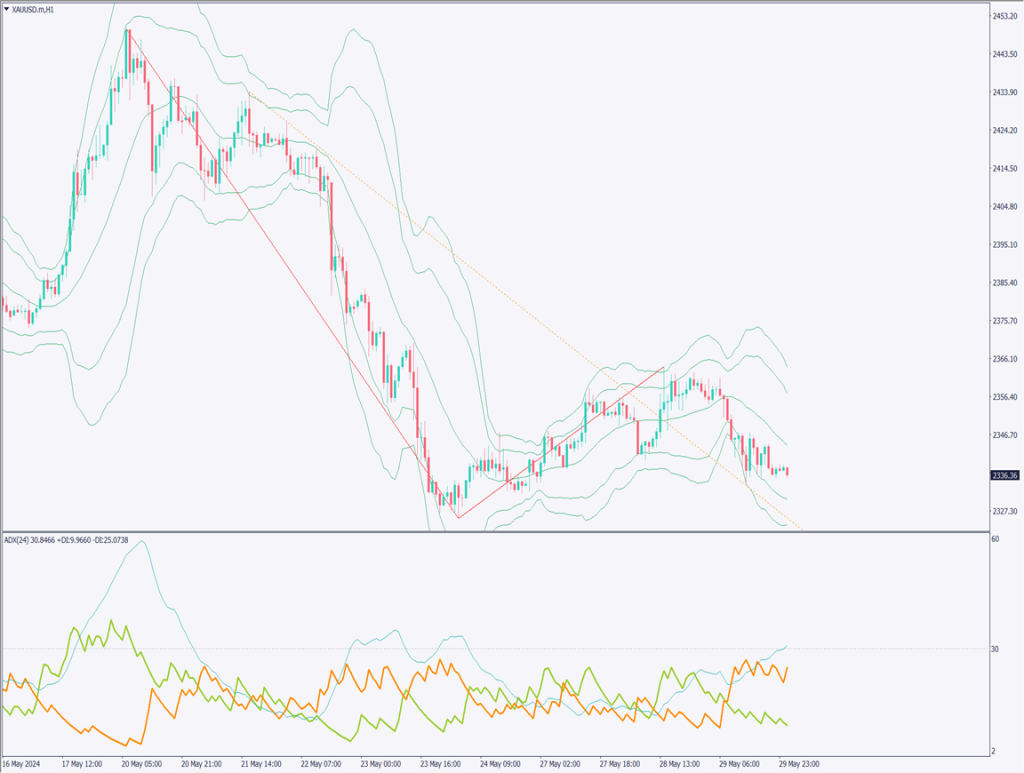
Checking the 1-hour chart of gold, after rebounding around 2327 USD, gold continued a gradual correction but has turned downward again. The ADX indicates that -DI is above -25, and ADX is above 30, which is evidence of a strengthening downward trend.

Based on the Fibonacci expansion, the immediate target is around 2286 USD. There is a weekly support line at 2317 USD, which may take some time to break through.

For day trading, we should take a short to medium-term selling approach. For new short positions, the target is 2286 USD, with a stop at around 2350 USD.

Support/Resistance lines

The support and resistance lines to consider going forward are as follows:

  • 2286 USD: Fibonacci 61.8%
[USDJPY/ H1]

Market Sentiment

XAUUSD: Sell: 51% Buy: 49%

Featured Currency Pair of the Week (GBPCAD)

GBPCAD continues to show low volatility. The strengths of both currencies are balanced, and there is no clear direction. The recent high is 1.7450 CAD, and the recent low is 1.737 CAD, forming a range-bound market. Funds are concentrating on the CAD. A range strategy seems best for the British Pound to Canadian Dollar for now.

Today’s important economic indicators

Economic indicators and eventsJapan time
US Initial Jobless Claims21:30
US Core Personal Consumption Expenditures Price Index21:30
US GDP21:30
US Crude Oil InventoriesMidnight
FOMC Member Speech1:00 the next day

*Trading advice in this article is not provided by Milton Markets, but by Shu Fujiyasu Jr., a certified technical analyst.

Ready to trade?

Open live account

Related Analysis

Gold and Silver Continue to Hit Record Highs

Gold and Silver Continue to Hit Record Highs

19 days agoRead more →
Can Gold Renew Its Record High?

Can Gold Renew Its Record High?

10 days agoRead more →
No Currency Intervention Conducted; Reports of Additional Tariffs on South Korea

No Currency Intervention Conducted; Reports of Additional Tariffs on South Korea

20 days agoRead more →

This material is for informational purposes only and does not constitute investment advice. Trading leveraged products involves significant risk of loss. Past performance is not indicative of future results.

Share

X

Start trading today

  • Fast execution
  • Competitive spreads
  • 24/7 support
Open live accountView account types
Milton Markets
Twitter/XYouTube

Markets

FOREX
CRYPTO
COMMODITIES
INDICES
STOCKS

Trading

  • Flex Account
  • Smart Account
  • Elite Account
  • MetaTrader 5 (MT5)
  • MetaTrader 4 (MT4)
  • Launch WebTrader
  • Learn Hub
  • Economic Calendar
  • Promotions

Company

  • About Us
  • NDD Technology
  • Customer Protection
  • Execution Conditions
  • Company News
  • Blog
  • Market Analysis

Partners

  • IB Program
  • PAMM Program
  • White Label
  • Investor Login
  • Manager Login

Support

  • Terms of Service
  • Privacy Policy
  • Risk Disclosure
  • Contact Us
  • Help Center
  • My Page Login
Milton Markets is a trading name of Milton Markets Ltd. Milton Markets Ltd. is part of Milton Global and is registered in Saint Lucia (Registration Number: 2023-00166). As part of Milton Global, we adhere to the same high regulatory standards as Milton Global Ltd, which is regulated by the Seychelles Financial Services Authority (FSA) under license SD040.
Risk Warning: CFD trading carries high risk and may not suit all investors. You may lose more than your initial investment. Ensure you understand the risks before trading.
Restrictions: Milton Markets does not provide services to the following countries (not limited to these): United States, Canada, European Union countries, Iran, North Korea, Saint Vincent and the Grenadines, Afghanistan, American Samoa, Belarus, Russia, Burundi, Central African Republic, Congo (Brazzaville), Cuba, Iraq, Lebanon, Liberia, Libya, Myanmar, Puerto Rico, Rwanda, Somalia, Sudan, Syria, US Virgin Islands, Venezuela, Yemen, Zimbabwe, Côte d'Ivoire, Mali, Guinea, Eritrea.
You must be 18 years old or the legal age in your country of residence.
By opening an account, you are considered to have registered of your own volition without solicitation from Milton Markets.
Disclaimer: This website does not constitute investment advice. Content should not be construed as personal advice. Seek independent financial advice.
© 2026 Milton Markets. All rights reserved.
TermsPrivacyCookiesRisk