Milton Markets
Markets
Trading
Company
Partners
Sign InOpen Account
  1. Home/
  2. Market Analysis/
  3. USDJPY Rebounds Sharply, US Economic Indicators Show Mixed Results【June 6, 2024】
Koki Ando•Jun 6, 2024

USDJPY Rebounds Sharply, US Economic Indicators Show Mixed Results【June 6, 2024】

Koki Ando headshot

Daily Market Analysis

Koki AndoChief Market Analyst

Expert analysis of today's market movements and trading opportunities

Koki Ando headshot

Daily Market Analysis

Koki AndoChief Market Analyst

Expert analysis of today's market movements and trading opportunities

Fundamental Analysis

  • US ADP Employment Report Shows Weak Results, Lowest Since January
  • US ISM Non-Manufacturing Index Is Strong, Leading to USD Buying Recovery
  • Bank of Canada Decides on a 0.25% Rate Cut

USDJPY technical analysis

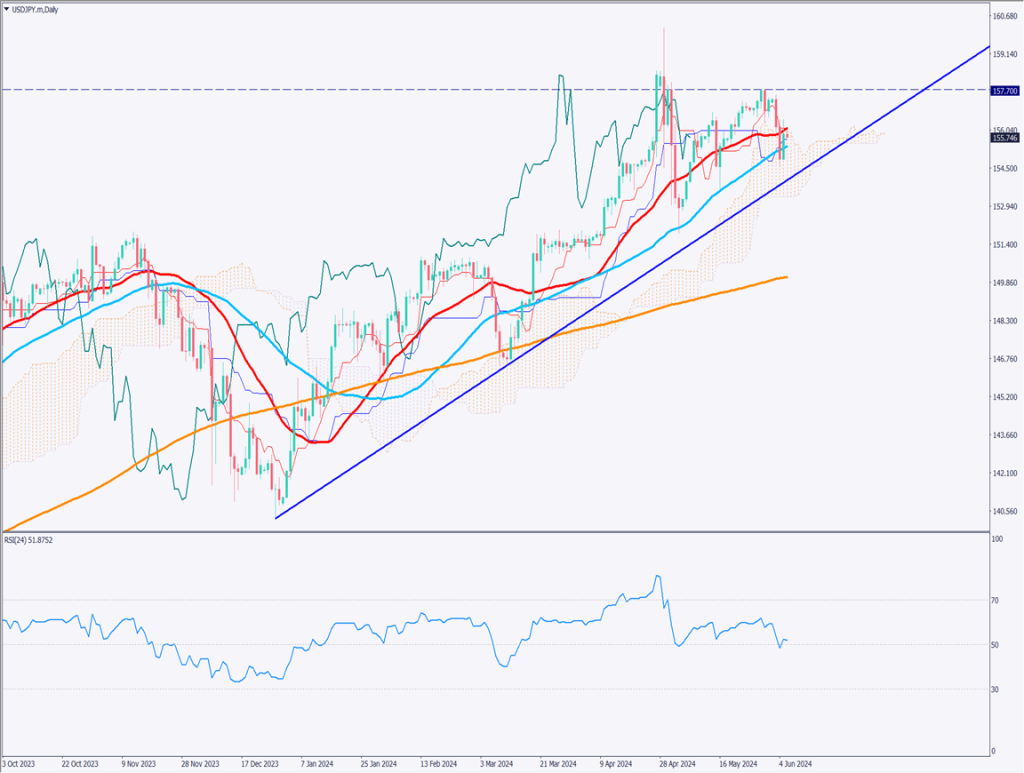
Analyzing the daily chart of USDJPY, it has rebounded sharply to the 156 JPY level. Technically, this rebound occurred at the 52-day moving average. Although the rise was strong enough to surpass the previous day’s high temporarily, it was pushed back by selling pressure, resulting in a harami pattern. It couldn’t surpass the 28-day moving average, being squeezed between key moving averages.

The uptrend has already broken, and it’s unlikely to see a continuous rise towards the 157 JPY or 158 JPY levels from here. The risk of a decline is considered higher. Although the US ISM index showed a strong economy, the employment situation is deteriorating, and a US rate cut is approaching.

We should remain cautious about the risk of a decline in USDJPY.

[USDJPY/ D1]

Day trading strategy (1 hour)

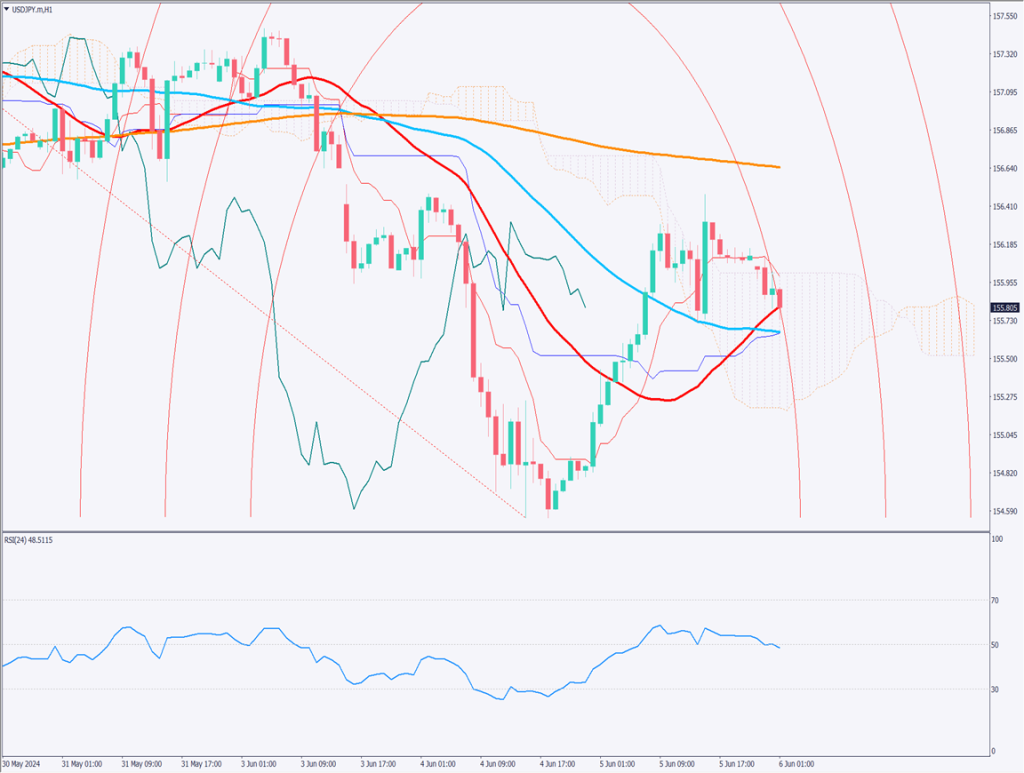
Analyzing the 1-hour chart of USDJPY, it is possibly forming a high. After rising to 156.48 JPY, it seems to be declining since the morning. The RSI has also fallen below 50, indicating a downward trend again. The 38.2% Fibonacci arc might be functioning as a resistance line.

Currently, it is moving within the cloud, trying to find direction, but it seems that the upward momentum is weak, and a downward trend is expected.

For day trading, consider selling in the early 156 JPY range, with the target for settlement around 155.35 JPY. The stop should be set at 156.50 JPY.

Support/Resistance lines

The following support and resistance lines should be considered:

  • 156.48 JPY: Recent High
  • 155.70 JPY: Monthly Pivot
[USDJPY/ H1]

Market Sentiment

USDJPY: Sell: 60% Buy: 40%

Featured Currency Pair of the Week (NZDCAD)

The Bank of Canada implemented a 0.25% rate cut as expected. The New Zealand Dollar to Canadian Dollar has risen for four consecutive days, currently trading around 0.8485 CAD. The Governor of the Bank of Canada commented that further rate cuts would depend on economic indicators, leading to strong selling of the Canadian Dollar. If it reaches the round number of 0.85 CAD, profit-taking sales are also expected. Pay attention to the breakout of 0.85 CAD.

Today’s important economic indicators

Economic indicators and eventsJapan time
ECB Policy Rate Announcement21:15
US Unemployment Claims21:30
ECB President Lagarde’s Press Conference23:15

*Trading advice in this article is not provided by Milton Markets, but by Shu Fujiyasu Jr., a certified technical analyst.

Ready to trade?

Open live account

Related Analysis

USD/JPY Forms a Range — What’s Next?

USD/JPY Forms a Range — What’s Next?

TodayRead more →
Can Gold Renew Its Record High?

Can Gold Renew Its Record High?

10 days agoRead more →
USD/JPY: Selling Pressure Dominates on Rallies

USD/JPY: Selling Pressure Dominates on Rallies

6 days agoRead more →

This material is for informational purposes only and does not constitute investment advice. Trading leveraged products involves significant risk of loss. Past performance is not indicative of future results.

Share

X

Start trading today

  • Fast execution
  • Competitive spreads
  • 24/7 support
Open live accountView account types
Milton Markets
Twitter/XYouTube

Markets

FOREX
CRYPTO
COMMODITIES
INDICES
STOCKS

Trading

  • Flex Account
  • Smart Account
  • Elite Account
  • MetaTrader 5 (MT5)
  • MetaTrader 4 (MT4)
  • Launch WebTrader
  • Learn Hub
  • Economic Calendar
  • Promotions

Company

  • About Us
  • NDD Technology
  • Customer Protection
  • Execution Conditions
  • Company News
  • Blog
  • Market Analysis

Partners

  • IB Program
  • PAMM Program
  • White Label
  • Investor Login
  • Manager Login

Support

  • Terms of Service
  • Privacy Policy
  • Risk Disclosure
  • Contact Us
  • Help Center
  • My Page Login
Milton Markets is a trading name of Milton Markets Ltd. Milton Markets Ltd. is part of Milton Global and is registered in Saint Lucia (Registration Number: 2023-00166). As part of Milton Global, we adhere to the same high regulatory standards as Milton Global Ltd, which is regulated by the Seychelles Financial Services Authority (FSA) under license SD040.
Risk Warning: CFD trading carries high risk and may not suit all investors. You may lose more than your initial investment. Ensure you understand the risks before trading.
Restrictions: Milton Markets does not provide services to the following countries (not limited to these): United States, Canada, European Union countries, Iran, North Korea, Saint Vincent and the Grenadines, Afghanistan, American Samoa, Belarus, Russia, Burundi, Central African Republic, Congo (Brazzaville), Cuba, Iraq, Lebanon, Liberia, Libya, Myanmar, Puerto Rico, Rwanda, Somalia, Sudan, Syria, US Virgin Islands, Venezuela, Yemen, Zimbabwe, Côte d'Ivoire, Mali, Guinea, Eritrea.
You must be 18 years old or the legal age in your country of residence.
By opening an account, you are considered to have registered of your own volition without solicitation from Milton Markets.
Disclaimer: This website does not constitute investment advice. Content should not be construed as personal advice. Seek independent financial advice.
© 2026 Milton Markets. All rights reserved.
TermsPrivacyCookiesRisk