Milton Markets
Markets
Trading
Company
Partners
Sign InOpen Account
  1. Home/
  2. Market Analysis/
  3. Gold Plummets, U.S. Employment Report Surprises【June 10, 2024】
Koki Ando•Jun 10, 2024

Gold Plummets, U.S. Employment Report Surprises【June 10, 2024】

Koki Ando headshot

Daily Market Analysis

Koki AndoChief Market Analyst

Expert analysis of today's market movements and trading opportunities

Koki Ando headshot

Daily Market Analysis

Koki AndoChief Market Analyst

Expert analysis of today's market movements and trading opportunities

Fundamental Analysis

  • The U.S. employment report surprises with a significant increase in new hires.
  • The forex market sees a strong USD, with rate cut expectations diminishing.
  • Interest rate forecasts are scheduled to be announced this week, with a shift from twice to once a year cut expectation.

XAUUSD technical analysis

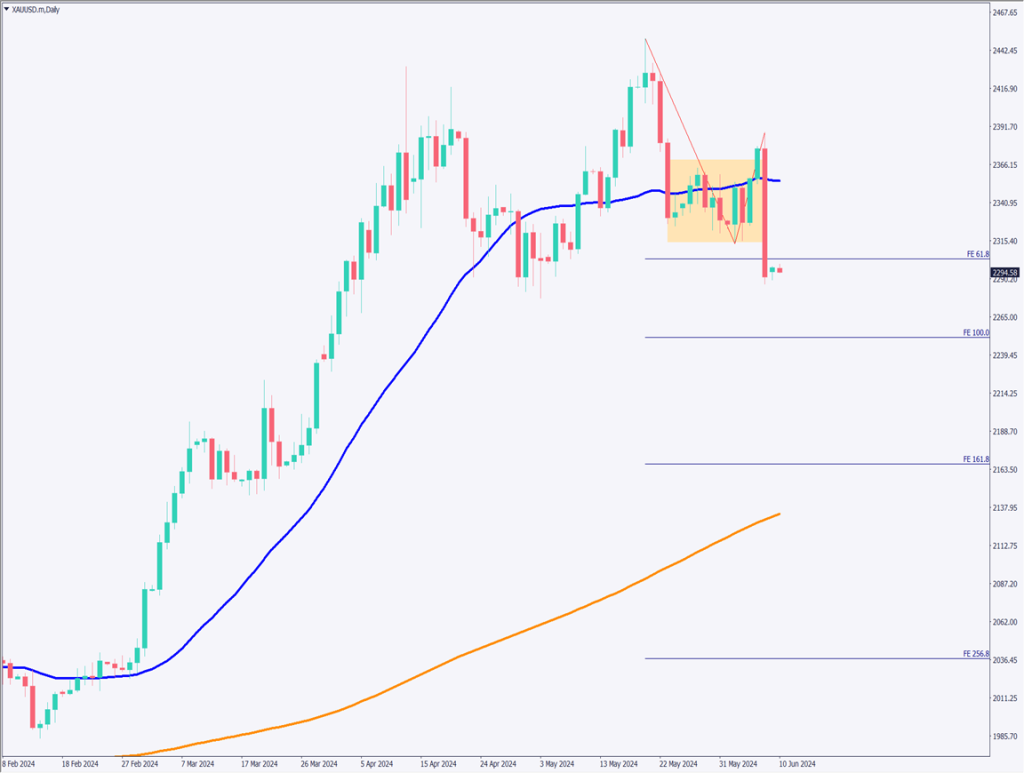
Analyzing the daily chart of gold. Gold has significantly fallen below the 28-day moving average, showing a pattern similar to the three black crows. An engulfing pattern at the high range is one sign indicating a potential decline. Drawing the Fibonacci expansion reveals that it has broken below 61.8% and is aiming for 100%.

A major support line is around 2255USD to 2265USD, indicating a potential sharp drop until this range, requiring caution. However, with the RSI at 32, a sharp rebound is also possible.

[XAUUSD/ D1]

Day trading strategy (1 hour)

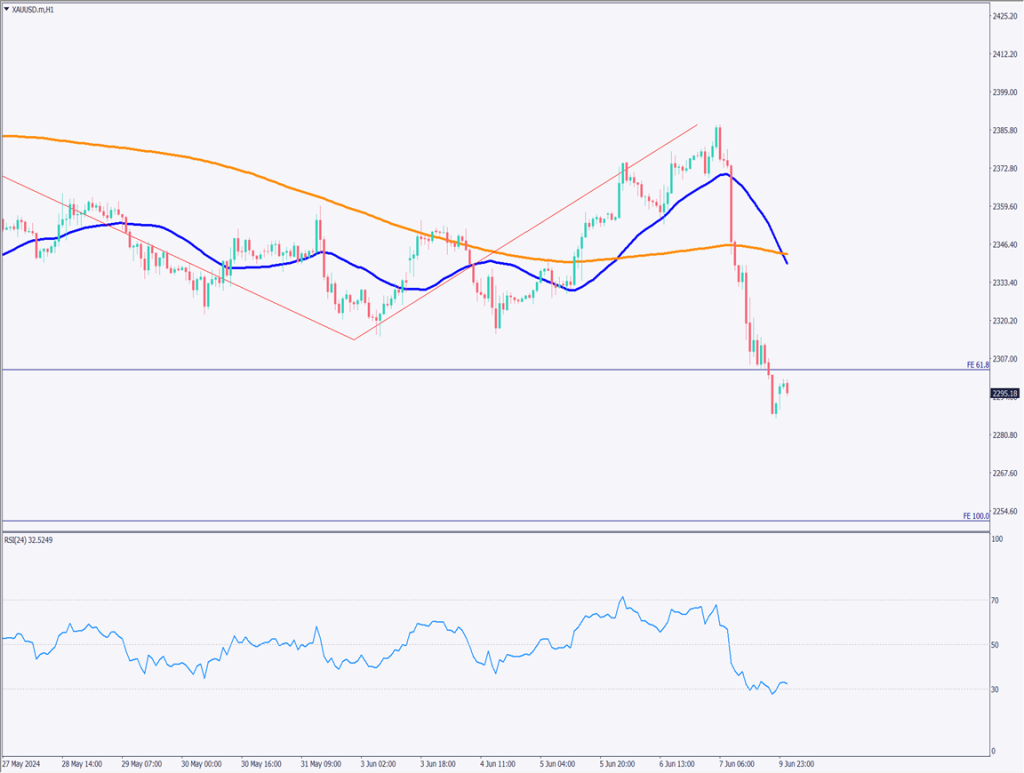
Analyzing the 1-hour chart of gold. The 28MA has fallen below the 52MA, completing a death cross. The downward trend is expected to continue for a while. Despite the dot plot announcement this week, the surprise in the employment report suggests a selling-led market. If it reaches the 2300USD range, selling pressure may increase.

Currently, the RSI is at 32, indicating it is slightly oversold. However, the significant reduction in rate cut expectations implies that the possibility of a July rate cut is now considered null. Therefore, the day trading strategy remains to approach with selling.

The day trading strategy is to sell when approaching 2300USD. Continuously sell down to 2260USD. Due to the possibility of a rebound, careful position management is required. The strategy involves frequently selling and settling.

Support/Resistance lines

The support and resistance lines to consider are as follows:

2265USD: Major support line

2250USD: Fibonacci 100%

[XAUUSD/ H1]

Market Sentiment

XAUUSD Sell: 61%, Buy: 39%

Featured Currency Pair of the Week (GBPNZD)

GBP/NZD surged from 2.06NZD to 2.08NZD. The RSI at 51 indicates an upward trend for the first time in a while. Due to the U.S. employment report, NZD selling outweighed GBP selling, resulting in a surge in GBPNZD. A slightly tricky market. This week, multiple UK economic indicators are scheduled to be released and should be noted.

Today’s important economic indicators

Economic indicators and eventsJapan time
Japan GDP8:50

*Trading advice in this article is not provided by Milton Markets, but by Shu Fujiyasu Jr., a certified technical analyst.

Ready to trade?

Open live account

Related Analysis

No Currency Intervention Conducted; Reports of Additional Tariffs on South Korea

No Currency Intervention Conducted; Reports of Additional Tariffs on South Korea

20 days agoRead more →
Can Gold Renew Its Record High?

Can Gold Renew Its Record High?

10 days agoRead more →
USD/JPY Forms a Range — What’s Next?

USD/JPY Forms a Range — What’s Next?

TodayRead more →

This material is for informational purposes only and does not constitute investment advice. Trading leveraged products involves significant risk of loss. Past performance is not indicative of future results.

Share

X

Start trading today

  • Fast execution
  • Competitive spreads
  • 24/7 support
Open live accountView account types
Milton Markets
Twitter/XYouTube

Markets

FOREX
CRYPTO
COMMODITIES
INDICES
STOCKS

Trading

  • Flex Account
  • Smart Account
  • Elite Account
  • MetaTrader 5 (MT5)
  • MetaTrader 4 (MT4)
  • Launch WebTrader
  • Learn Hub
  • Economic Calendar
  • Promotions

Company

  • About Us
  • NDD Technology
  • Customer Protection
  • Execution Conditions
  • Company News
  • Blog
  • Market Analysis

Partners

  • IB Program
  • PAMM Program
  • White Label
  • Investor Login
  • Manager Login

Support

  • Terms of Service
  • Privacy Policy
  • Risk Disclosure
  • Contact Us
  • Help Center
  • My Page Login
Milton Markets is a trading name of Milton Markets Ltd. Milton Markets Ltd. is part of Milton Global and is registered in Saint Lucia (Registration Number: 2023-00166). As part of Milton Global, we adhere to the same high regulatory standards as Milton Global Ltd, which is regulated by the Seychelles Financial Services Authority (FSA) under license SD040.
Risk Warning: CFD trading carries high risk and may not suit all investors. You may lose more than your initial investment. Ensure you understand the risks before trading.
Restrictions: Milton Markets does not provide services to the following countries (not limited to these): United States, Canada, European Union countries, Iran, North Korea, Saint Vincent and the Grenadines, Afghanistan, American Samoa, Belarus, Russia, Burundi, Central African Republic, Congo (Brazzaville), Cuba, Iraq, Lebanon, Liberia, Libya, Myanmar, Puerto Rico, Rwanda, Somalia, Sudan, Syria, US Virgin Islands, Venezuela, Yemen, Zimbabwe, Côte d'Ivoire, Mali, Guinea, Eritrea.
You must be 18 years old or the legal age in your country of residence.
By opening an account, you are considered to have registered of your own volition without solicitation from Milton Markets.
Disclaimer: This website does not constitute investment advice. Content should not be construed as personal advice. Seek independent financial advice.
© 2026 Milton Markets. All rights reserved.
TermsPrivacyCookiesRisk