Milton Markets
Markets
Trading
Company
Partners
Sign InOpen Account
  1. Home/
  2. Market Analysis/
  3. USDJPY Rises, BOJ Policy Meeting Indicates Yen Weakness【June 14, 2024】
Koki Ando•Jun 14, 2024

USDJPY Rises, BOJ Policy Meeting Indicates Yen Weakness【June 14, 2024】

Koki Ando headshot

Daily Market Analysis

Koki AndoChief Market Analyst

Expert analysis of today's market movements and trading opportunities

Koki Ando headshot

Daily Market Analysis

Koki AndoChief Market Analyst

Expert analysis of today's market movements and trading opportunities

Fundamental Analysis

  • The BOJ policy meeting is being held, and historically, the yen tends to weaken on the days of these meetings
  • The US PPI fell short of expectations, indicating a slowdown in US inflation
  • Gold faces selling pressure, dropping to the 2300 USD range

USDJPY technical analysis

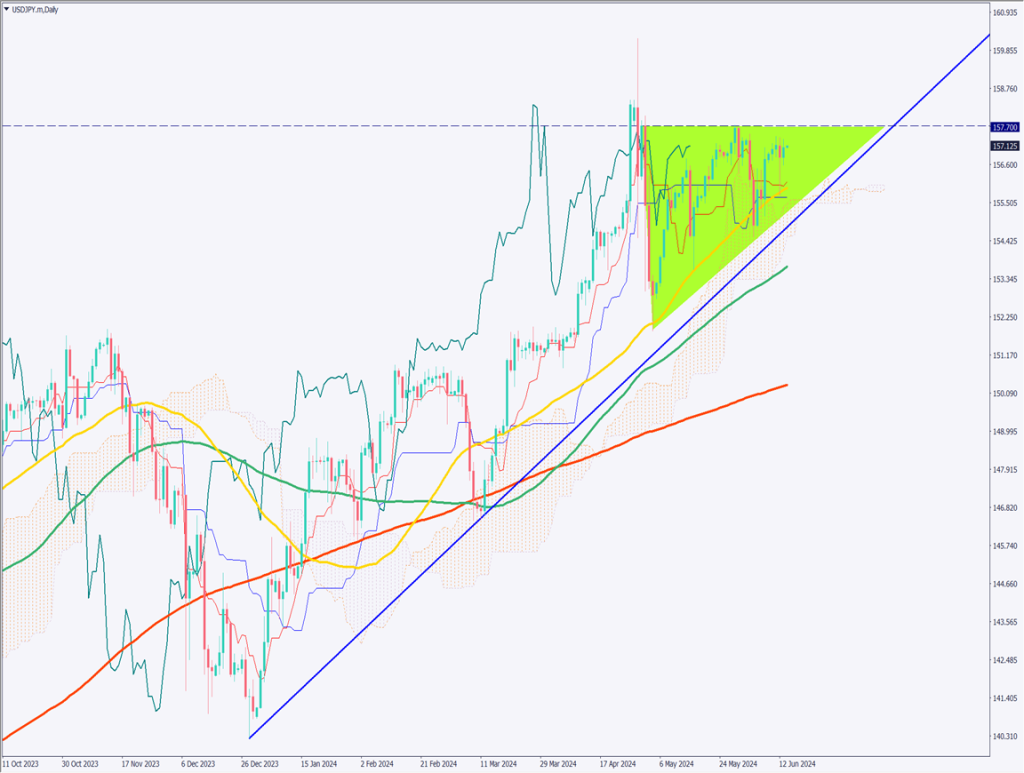
Analyzing the daily USDJPY chart, a triangle pattern is forming with the upper boundary at 157.70 JPY and rising lows. Today’s BOJ policy meeting is expected to discuss reducing the amount of government bond purchases, but a significant reduction is unlikely.

Historically, USDJPY tends to weaken during BOJ policy meetings. The focus will be on whether it can break through 157.70 JPY. It has rebounded from the 28-day moving average, and if it breaks above 157.70 JPY, it could target 158.25 JPY.

Attention will also be on whether Governor Ueda will mention future interest rate outlooks during his press conference.

[USDJPY/ D1]

Day trading strategy (1 hour)

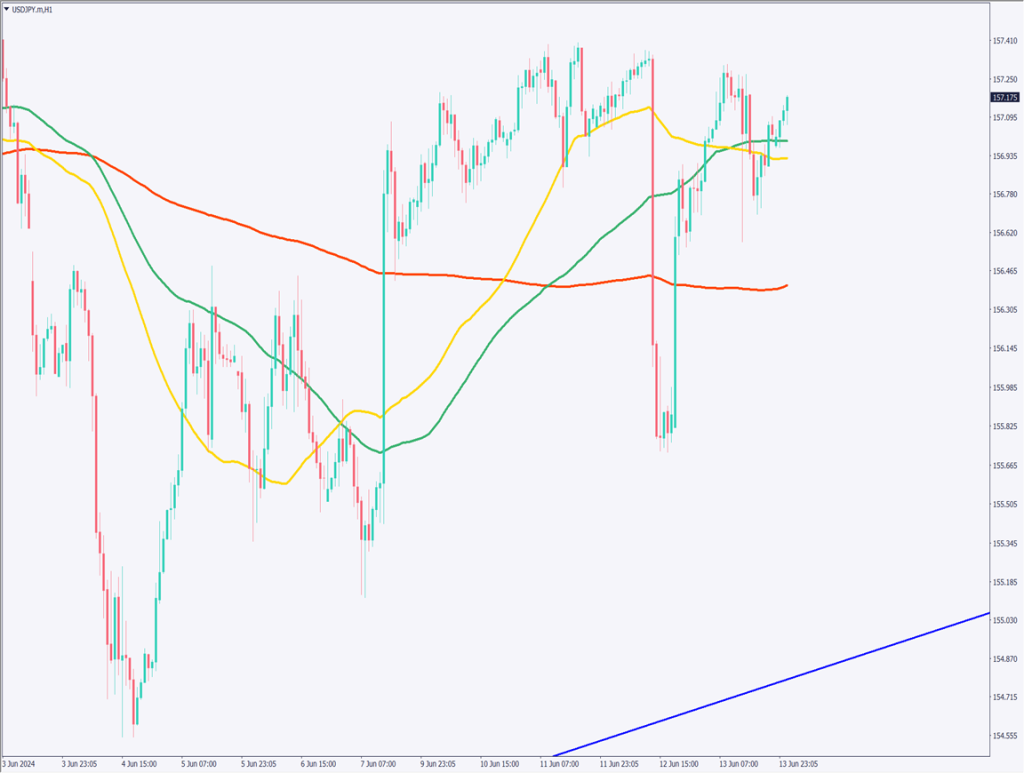
Analyzing the 1-hour chart, USDJPY fluctuates repeatedly, reacting to economic indicators. The BOJ policy meeting is scheduled today, with no changes in policy rates expected. Consequently, some overseas investors anticipating this may sell yen, leading to potential yen weakness today. A reduction in the amount of government bond purchases is expected to be gradual.

Focus on whether it can break through 157.70 JPY. Trade cautiously during Tokyo hours. In the broader perspective, a weakening yen means picking up at the lows carefully.

Support/Resistance lines

The following support and resistance lines should be considered going forward:

157.70 JPY – Recent High

[USDJPY/ H1]

Market Sentiment

USDJPY – Sell: 60% Buy: 40%

Featured Currency Pair of the Week (GBPNZD)

The GBP to NZD is rising. It is moving near the 200-day moving average, determining its direction. It has broken the weekly uptrend line, indicating a slight pound depreciation. The recent low is around 2.06 USD. Pay attention to whether it breaks 2.06 NZD, with the 200-day moving average acting as resistance.

Today’s important economic indicators

Economic indicators and eventsJapan time
BOJ Policy Rate AnnouncementAround 12:00
BOJ Governor Press Conference15:30
University of Michigan Consumer Sentiment Index23:00
FRB Monetary Policy ReportMidnight

*Trading advice in this article is not provided by Milton Markets, but by Shu Fujiyasu Jr., a certified technical analyst.

Ready to trade?

Open live account

Related Analysis

Gold and Silver Continue to Hit Record Highs

Gold and Silver Continue to Hit Record Highs

19 days agoRead more →
USD/JPY Forms a Range — What’s Next?

USD/JPY Forms a Range — What’s Next?

TodayRead more →
USD/JPY: Selling Pressure Dominates on Rallies

USD/JPY: Selling Pressure Dominates on Rallies

6 days agoRead more →

This material is for informational purposes only and does not constitute investment advice. Trading leveraged products involves significant risk of loss. Past performance is not indicative of future results.

Share

X

Start trading today

  • Fast execution
  • Competitive spreads
  • 24/7 support
Open live accountView account types
Milton Markets
Twitter/XYouTube

Markets

FOREX
CRYPTO
COMMODITIES
INDICES
STOCKS

Trading

  • Flex Account
  • Smart Account
  • Elite Account
  • MetaTrader 5 (MT5)
  • MetaTrader 4 (MT4)
  • Launch WebTrader
  • Learn Hub
  • Economic Calendar
  • Promotions

Company

  • About Us
  • NDD Technology
  • Customer Protection
  • Execution Conditions
  • Company News
  • Blog
  • Market Analysis

Partners

  • IB Program
  • PAMM Program
  • White Label
  • Investor Login
  • Manager Login

Support

  • Terms of Service
  • Privacy Policy
  • Risk Disclosure
  • Contact Us
  • Help Center
  • My Page Login
Milton Markets is a trading name of Milton Markets Ltd. Milton Markets Ltd. is part of Milton Global and is registered in Saint Lucia (Registration Number: 2023-00166). As part of Milton Global, we adhere to the same high regulatory standards as Milton Global Ltd, which is regulated by the Seychelles Financial Services Authority (FSA) under license SD040.
Risk Warning: CFD trading carries high risk and may not suit all investors. You may lose more than your initial investment. Ensure you understand the risks before trading.
Restrictions: Milton Markets does not provide services to the following countries (not limited to these): United States, Canada, European Union countries, Iran, North Korea, Saint Vincent and the Grenadines, Afghanistan, American Samoa, Belarus, Russia, Burundi, Central African Republic, Congo (Brazzaville), Cuba, Iraq, Lebanon, Liberia, Libya, Myanmar, Puerto Rico, Rwanda, Somalia, Sudan, Syria, US Virgin Islands, Venezuela, Yemen, Zimbabwe, Côte d'Ivoire, Mali, Guinea, Eritrea.
You must be 18 years old or the legal age in your country of residence.
By opening an account, you are considered to have registered of your own volition without solicitation from Milton Markets.
Disclaimer: This website does not constitute investment advice. Content should not be construed as personal advice. Seek independent financial advice.
© 2026 Milton Markets. All rights reserved.
TermsPrivacyCookiesRisk