Milton Markets
Markets
Trading
Company
Partners
Sign InOpen Account
  1. Home/
  2. Market Analysis/
  3. USDJPY Continues to Rise Slightly, Approaching 158 JPY【June 19, 2024】
Koki Ando•Jun 19, 2024

USDJPY Continues to Rise Slightly, Approaching 158 JPY【June 19, 2024】

Koki Ando headshot

Daily Market Analysis

Koki AndoChief Market Analyst

Expert analysis of today's market movements and trading opportunities

Koki Ando headshot

Daily Market Analysis

Koki AndoChief Market Analyst

Expert analysis of today's market movements and trading opportunities

Fundamental Analysis

  • President of the New York Federal Reserve Comments “The Economy is Moving in the Right Direction”
  • U.S. Retail Sales See Slight Increase, Expectations for a Soft Landing
  • Global Central Banks Increase Gold Holdings, Supporting Gold Prices

USDJPY technical analysis

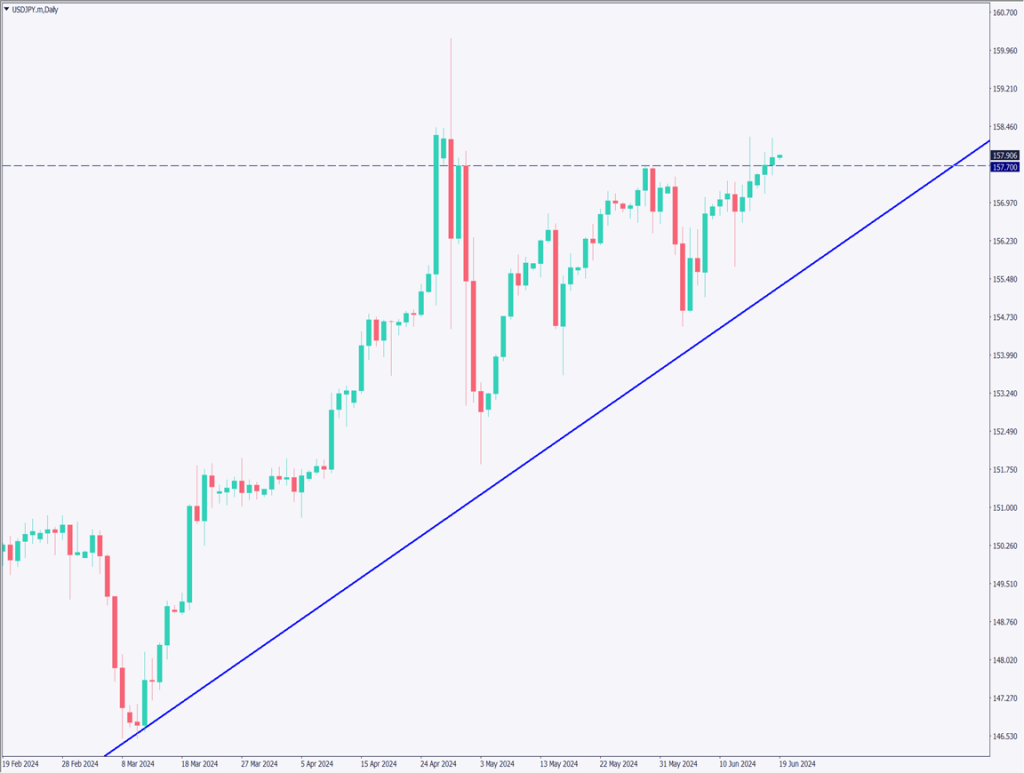
USDJPY continues to rise slightly. It is currently trading in the high 157 JPY range and is approaching the 158 JPY level. It has surpassed the recent high of 157.70 JPY and is aiming for 158.25 JPY. If it breaks above 158.25 JPY, there is a resistance level at 158.44 JPY. If it closes above the 158 JPY range, the 160 JPY level may come into view.

Although the Bank of Japan’s decision to reduce government bond purchases has been announced, specific plans have been postponed, leading to yen selling. Meanwhile, Governor Ueda commented that there is a possibility of a policy rate hike at the July meeting. However, it is expected that the rate hike will not be as aggressive as the market hopes, and the pressure towards yen appreciation is limited. It seems that yen selling will gradually continue.

[USDJPY/ D1]

Day trading strategy (1 hour)

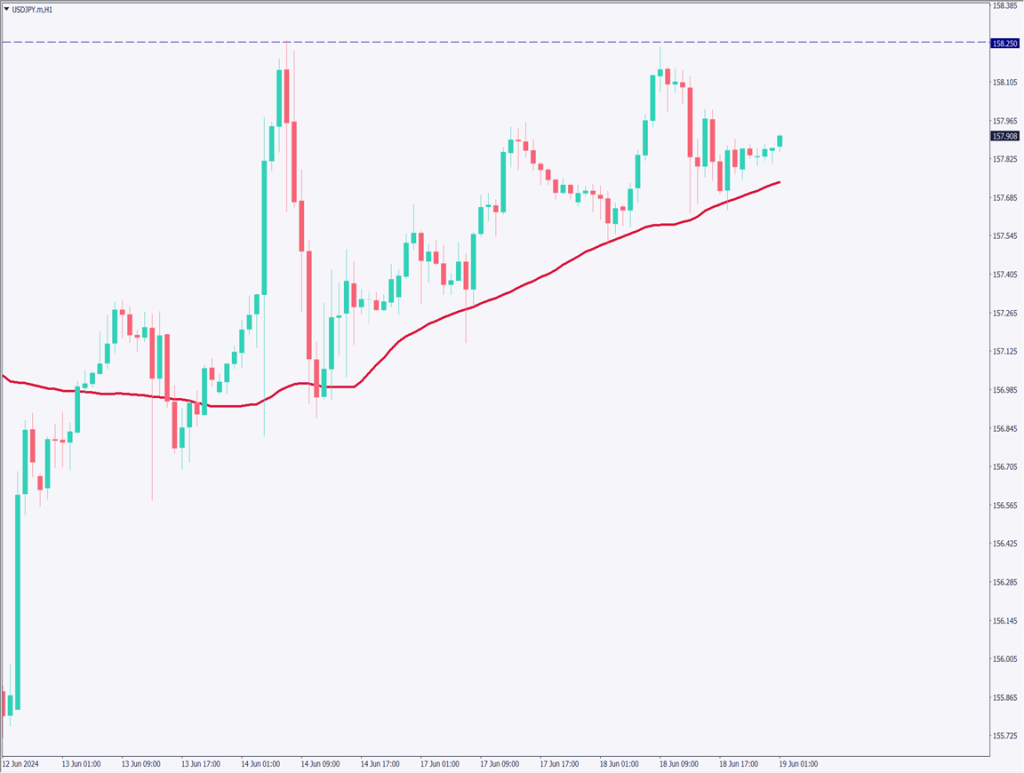
Analyzing the hourly chart of USDJPY, it continues to rise while gradually raising its lows. It repeats rising and falling, with 158.25 JPY acting as resistance. Since no significant events are scheduled, selling pressure may increase in the 158 JPY range.

The day trading strategy considers a sell entry at the high of 158.80 JPY. The target is set at 158.25 JPY, and the stop is at 159.15 JPY.

Support/Resistance lines

The support and resistance lines to consider going forward are as follows:

  • 158.25 JPY: Recent high
[USDJPY/ H1]

Market Sentiment

USDJPY: Sell: 65% Buy: 35%

Featured Currency Pair of the Week (USDCAD)

The U.S. Dollar to Canadian Dollar has been falling for two consecutive days. With the sharp rise in oil prices, the Canadian Dollar has become more favorable for buying. Oil prices have surged from the 72 USD range to the 80 USD range in two weeks. It has been consistently bought since the beginning of this week. As a result, the U.S. Dollar to Canadian Dollar has seen the Canadian Dollar more favorable for buying, leading to long upper wicks on the daily candlesticks. The tug-of-war between the U.S. Dollar and the Canadian Dollar continues.

Although it is difficult to determine the direction, from a broader perspective, the outlook seems bullish. We might consider buying after it falls to around 1.366 CAD.

Today’s important economic indicators

Economic indicators and eventsJapan time
U.S. HolidayStock Market Closed
UK Consumer Price Index15:00

*Trading advice in this article is not provided by Milton Markets, but by Shu Fujiyasu Jr., a certified technical analyst.

Ready to trade?

Open live account

Related Analysis

USD/JPY dips slightly on LDP landslide victory

USD/JPY dips slightly on LDP landslide victory

7 days agoRead more →
USD/JPY Forms a Range — What’s Next?

USD/JPY Forms a Range — What’s Next?

TodayRead more →
Gold and Silver Continue to Hit Record Highs

Gold and Silver Continue to Hit Record Highs

19 days agoRead more →

This material is for informational purposes only and does not constitute investment advice. Trading leveraged products involves significant risk of loss. Past performance is not indicative of future results.

Share

X

Start trading today

  • Fast execution
  • Competitive spreads
  • 24/7 support
Open live accountView account types
Milton Markets
Twitter/XYouTube

Markets

FOREX
CRYPTO
COMMODITIES
INDICES
STOCKS

Trading

  • Flex Account
  • Smart Account
  • Elite Account
  • MetaTrader 5 (MT5)
  • MetaTrader 4 (MT4)
  • Launch WebTrader
  • Learn Hub
  • Economic Calendar
  • Promotions

Company

  • About Us
  • NDD Technology
  • Customer Protection
  • Execution Conditions
  • Company News
  • Blog
  • Market Analysis

Partners

  • IB Program
  • PAMM Program
  • White Label
  • Investor Login
  • Manager Login

Support

  • Terms of Service
  • Privacy Policy
  • Risk Disclosure
  • Contact Us
  • Help Center
  • My Page Login
Milton Markets is a trading name of Milton Markets Ltd. Milton Markets Ltd. is part of Milton Global and is registered in Saint Lucia (Registration Number: 2023-00166). As part of Milton Global, we adhere to the same high regulatory standards as Milton Global Ltd, which is regulated by the Seychelles Financial Services Authority (FSA) under license SD040.
Risk Warning: CFD trading carries high risk and may not suit all investors. You may lose more than your initial investment. Ensure you understand the risks before trading.
Restrictions: Milton Markets does not provide services to the following countries (not limited to these): United States, Canada, European Union countries, Iran, North Korea, Saint Vincent and the Grenadines, Afghanistan, American Samoa, Belarus, Russia, Burundi, Central African Republic, Congo (Brazzaville), Cuba, Iraq, Lebanon, Liberia, Libya, Myanmar, Puerto Rico, Rwanda, Somalia, Sudan, Syria, US Virgin Islands, Venezuela, Yemen, Zimbabwe, Côte d'Ivoire, Mali, Guinea, Eritrea.
You must be 18 years old or the legal age in your country of residence.
By opening an account, you are considered to have registered of your own volition without solicitation from Milton Markets.
Disclaimer: This website does not constitute investment advice. Content should not be construed as personal advice. Seek independent financial advice.
© 2026 Milton Markets. All rights reserved.
TermsPrivacyCookiesRisk