Milton Markets
Markets
Trading
Company
Partners
Sign InOpen Account
  1. Home/
  2. Market Analysis/
  3. USDJPY Rebounds, Supported by Ichimoku Cloud【July 19, 2024】
Koki Ando•Jul 19, 2024

USDJPY Rebounds, Supported by Ichimoku Cloud【July 19, 2024】

Koki Ando headshot

Daily Market Analysis

Koki AndoChief Market Analyst

Expert analysis of today's market movements and trading opportunities

Koki Ando headshot

Daily Market Analysis

Koki AndoChief Market Analyst

Expert analysis of today's market movements and trading opportunities

Fundamental Analysis

  • U.S. jobless claims increase, halting USD buying
  • USDJPY rebounds; today’s movements could set the tone for next week
  • Ichimoku cloud provides support, will it return within the channel?

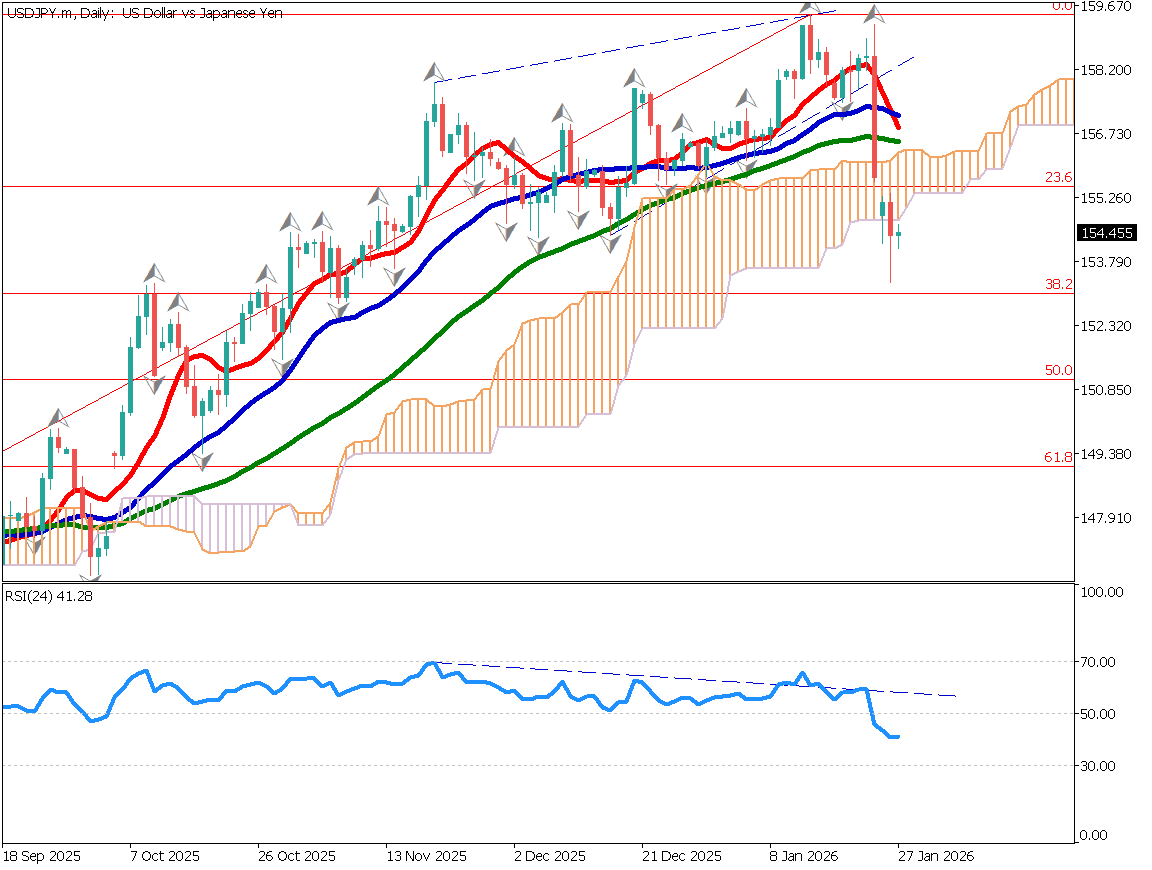
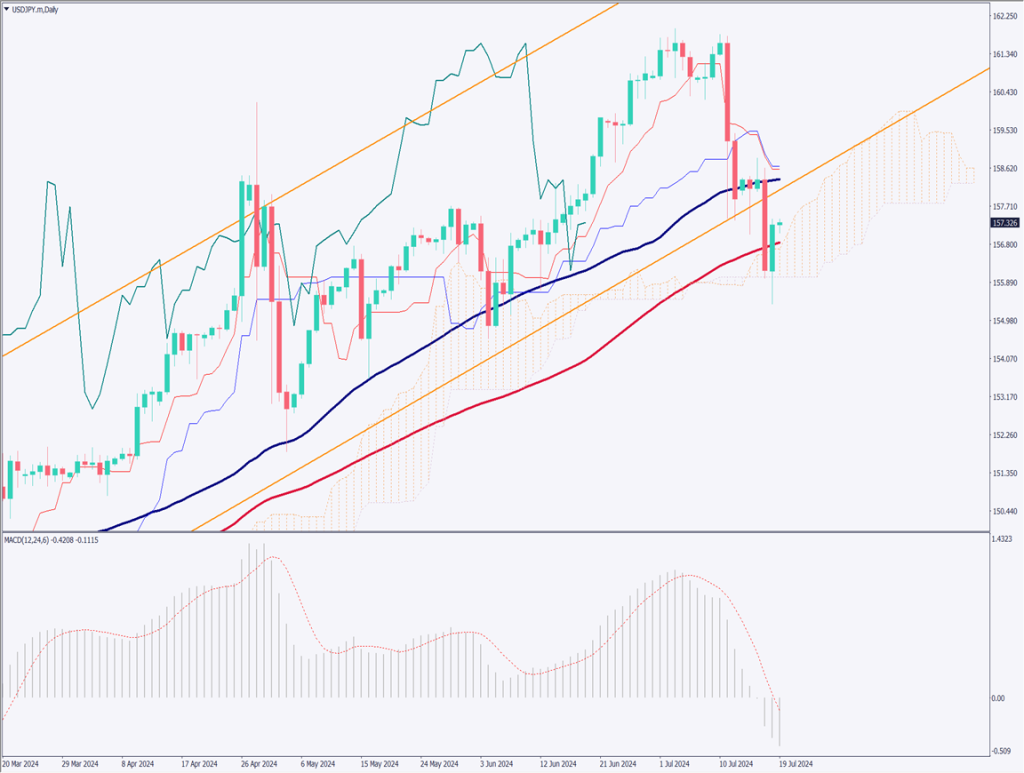
USDJPY technical analysis

USDJPY dropped to around 155.36JPY but rebounded. The rise in expectations for a U.S. rate cut, Trump’s remarks, demands for rate hikes by ministers, and interventions by the Bank of Japan caused a sharp drop from the 162JPY level to the 155JPY level.

However, Trump is not yet president, and it is seen as difficult for the BOJ to implement rate hikes while simultaneously reducing bond purchases. Also, currency intervention is considered a last resort, and Finance Minister Kanda will retire at the end of July. It is unlikely that the new finance minister will immediately intervene in the currency market.

Therefore, if the factors for JPY appreciation are absorbed, JPY depreciation might occur again. The MACD shows a bearish signal, and the Ichimoku cloud is acting as a support zone. Both scenarios are possible at this point.

[USDJPY/ D1]

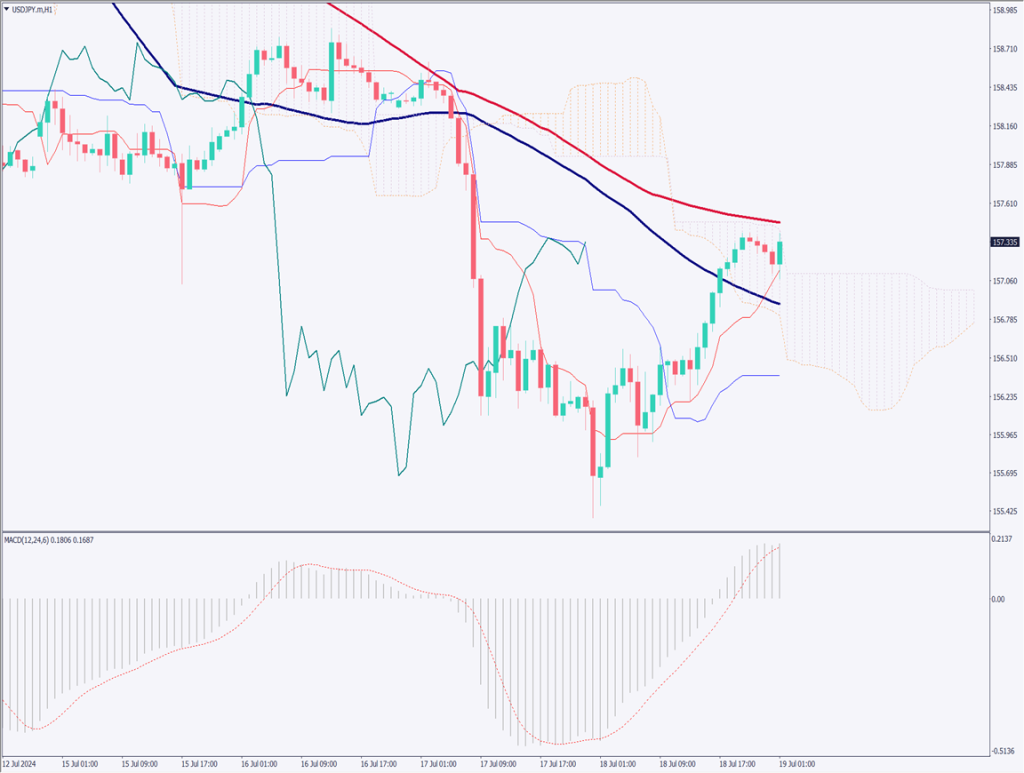
Day trading strategy (1 hour)

Analyzing the 1-hour USDJPY chart, it appears to have found a bottom around the 155JPY level. It resembles an inverse head and shoulders pattern. If it breaks the neckline, it might aim for around 158.30JPY.

The day trading policy is to buy. Enter around the low 157JPY range and aim to exit just before the 158JPY range. If it falls below 156.85JPY, consider exiting.

Support/Resistance lines

Future support and resistance lines to consider are as follows:

157.70JPY – Previous high

[USDJPY/ H1]

Market Sentiment

USDJPY Sell: 51% Buy: 49%

Featured Currency Pair of the Week (EURJPY)

EURJPY has rebounded and recovered to 171JPY. It bounced off the 52-day moving average, but it’s uncertain if it will return to a JPY depreciation trend. From a medium- to long-term perspective, the 52-day moving average has reacted at least four times in the past. Observing past movements, after hitting the 52-day moving average, bullish candles appeared consecutively the next day, leading to a new recent high.

Considering Trump’s remarks, demands for rate hikes by Minister Kono, and the BOJ meeting at the end of the month, there are JPY appreciation factors, and the market environment is different from before. Be mindful of Trump’s influential statements.

Today’s important economic indicators

Economic indicators and eventsJapan time
Japanese Consumer Price Index8:30
UK Retail Sales15:00
Canadian Retail Sales21:30

*Trading advice in this article is not provided by Milton Markets, but by Shu Fujiyasu Jr., a certified technical analyst.

Ready to trade?

Open live account

Related Analysis

USD/JPY dips slightly on LDP landslide victory

USD/JPY dips slightly on LDP landslide victory

7 days agoRead more →
USD/JPY Forms a Range — What’s Next?

USD/JPY Forms a Range — What’s Next?

TodayRead more →
No Currency Intervention Conducted; Reports of Additional Tariffs on South Korea

No Currency Intervention Conducted; Reports of Additional Tariffs on South Korea

20 days agoRead more →

This material is for informational purposes only and does not constitute investment advice. Trading leveraged products involves significant risk of loss. Past performance is not indicative of future results.

Share

X

Start trading today

  • Fast execution
  • Competitive spreads
  • 24/7 support
Open live accountView account types
Milton Markets
Twitter/XYouTube

Markets

FOREX
CRYPTO
COMMODITIES
INDICES
STOCKS

Trading

  • Flex Account
  • Smart Account
  • Elite Account
  • MetaTrader 5 (MT5)
  • MetaTrader 4 (MT4)
  • Launch WebTrader
  • Learn Hub
  • Economic Calendar
  • Promotions

Company

  • About Us
  • NDD Technology
  • Customer Protection
  • Execution Conditions
  • Company News
  • Blog
  • Market Analysis

Partners

  • IB Program
  • PAMM Program
  • White Label
  • Investor Login
  • Manager Login

Support

  • Terms of Service
  • Privacy Policy
  • Risk Disclosure
  • Contact Us
  • Help Center
  • My Page Login
Milton Markets is a trading name of Milton Markets Ltd. Milton Markets Ltd. is part of Milton Global and is registered in Saint Lucia (Registration Number: 2023-00166). As part of Milton Global, we adhere to the same high regulatory standards as Milton Global Ltd, which is regulated by the Seychelles Financial Services Authority (FSA) under license SD040.
Risk Warning: CFD trading carries high risk and may not suit all investors. You may lose more than your initial investment. Ensure you understand the risks before trading.
Restrictions: Milton Markets does not provide services to the following countries (not limited to these): United States, Canada, European Union countries, Iran, North Korea, Saint Vincent and the Grenadines, Afghanistan, American Samoa, Belarus, Russia, Burundi, Central African Republic, Congo (Brazzaville), Cuba, Iraq, Lebanon, Liberia, Libya, Myanmar, Puerto Rico, Rwanda, Somalia, Sudan, Syria, US Virgin Islands, Venezuela, Yemen, Zimbabwe, Côte d'Ivoire, Mali, Guinea, Eritrea.
You must be 18 years old or the legal age in your country of residence.
By opening an account, you are considered to have registered of your own volition without solicitation from Milton Markets.
Disclaimer: This website does not constitute investment advice. Content should not be construed as personal advice. Seek independent financial advice.
© 2026 Milton Markets. All rights reserved.
TermsPrivacyCookiesRisk