Milton Markets
Markets
Trading
Company
Partners
Sign InOpen Account
  1. Home/
  2. Market Analysis/
  3. USDJPY Declines as Expectations Grow for BOJ Rate Hike and Reduction in Government Bond Purchases【July 25, 2024】
Koki Ando•Jul 25, 2024

USDJPY Declines as Expectations Grow for BOJ Rate Hike and Reduction in Government Bond Purchases【July 25, 2024】

Koki Ando headshot

Daily Market Analysis

Koki AndoChief Market Analyst

Expert analysis of today's market movements and trading opportunities

Koki Ando headshot

Daily Market Analysis

Koki AndoChief Market Analyst

Expert analysis of today's market movements and trading opportunities

Fundamental Analysis

  • USDJPY appreciates as the yen strengthens due to repeated calls for rate hikes and expectations for next week’s meeting.
  • The yen strengthens rapidly, and cross yen pairs also decline across the board.
  • The Nikkei 225 Index also drops sharply due to the strengthening yen, with export stocks falling.

USDJPY technical analysis

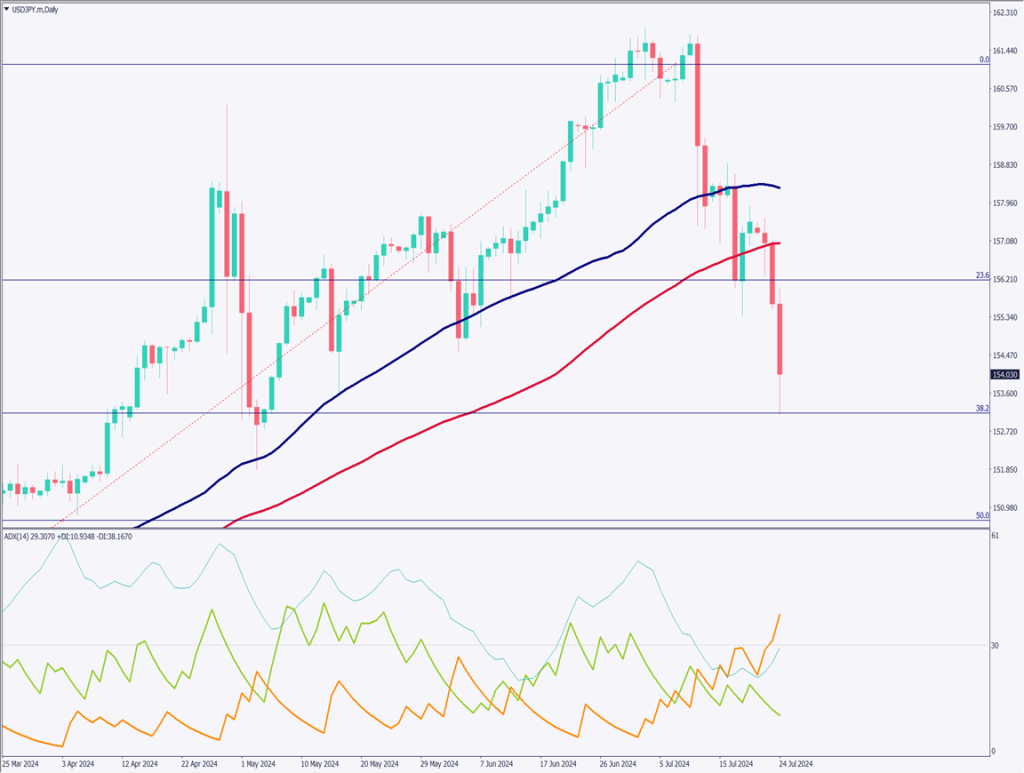
After confirming the occurrence of a downtrend according to Dow Theory, new selling positions may have been established. USDJPY has clearly fallen below the 90-day moving average and dropped sharply to the 38.2% Fibonacci retracement level.

The rapid appreciation of the yen is due to expectations of a simultaneous reduction in large-scale government bond purchases and a rate hike. Governor Ueda has hinted at the possibility of a simultaneous implementation, which could lead to USDJPY falling below 150 JPY. The ADX is approaching 30, and the -DI is at 38.

[USDJPY/ D1]

Day trading strategy (1 hour)

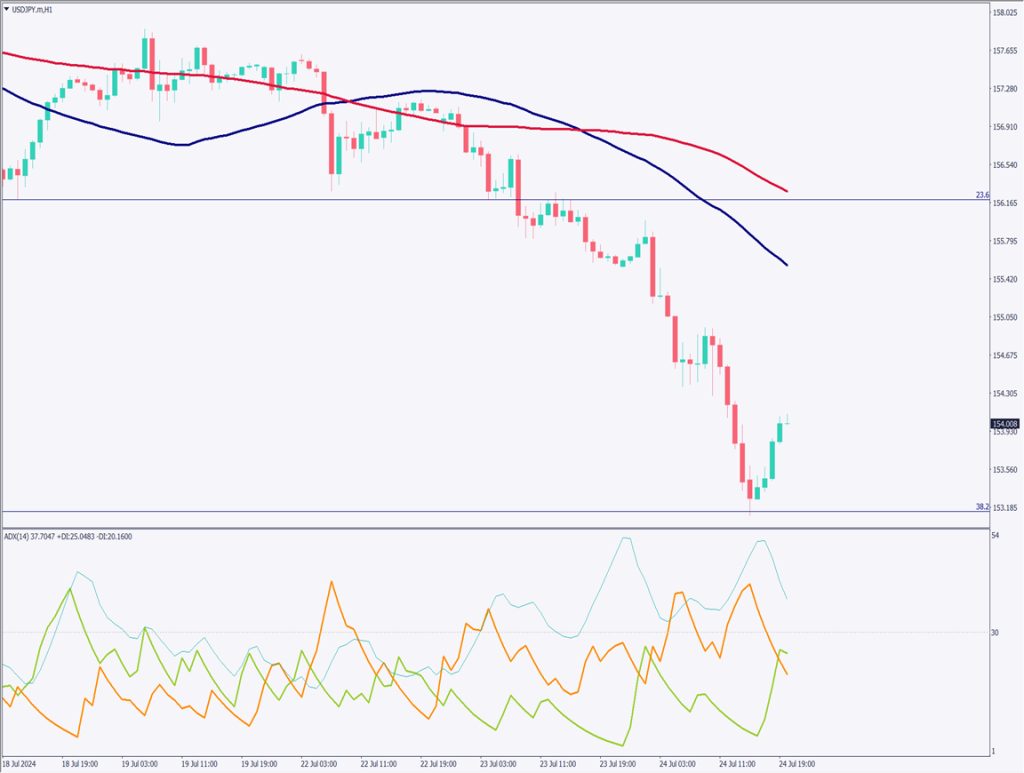
Analyzing the hourly chart of USDJPY, a rebound can be observed at the 38.2% level. As the pair is oversold, some recovery is expected. The strategy is to target the recovery high. Specifically, draw the Fibonacci retracement connecting the key price levels on the hourly chart, and look to sell around the 50% level.

Entry at 155.45 JPY, with a sell entry at the recovery, and close at 154.50 JPY. A stop is set above 155.90 JPY.

Support/Resistance lines

The support and resistance levels to consider going forward are as follows:

156.18 JPY .. Fibonacci level

153.10 JPY .. Recent low

[USDJPY/ H1]

Market Sentiment

USDJPY Sell: 36% Buy: 64%

Featured Currency Pair of the Week (USDCHF)

The US Dollar-Swiss Franc pair is declining sharply, with a strong dollar selling trend. The candlestick pattern suggests a downtrend, forming a “Three Black Crows” pattern with a large bearish candlestick + four small bullish candlesticks + a large bearish candlestick. The RSI is at 41, indicating ample room for a further decline. A drop to around 0.8820 CHF is anticipated.

Today’s important economic indicators

Economic indicators and eventsJapan time
US Core Durable Goods Orders21:30
US GDP21:30
ECB President LagardeMidnight

*Trading advice in this article is not provided by Milton Markets, but by Shu Fujiyasu Jr., a certified technical analyst.

Ready to trade?

Open live account

Related Analysis

USD/JPY Forms a Range — What’s Next?

USD/JPY Forms a Range — What’s Next?

TodayRead more →
USD/JPY: Selling Pressure Dominates on Rallies

USD/JPY: Selling Pressure Dominates on Rallies

6 days agoRead more →
Can Gold Renew Its Record High?

Can Gold Renew Its Record High?

10 days agoRead more →

This material is for informational purposes only and does not constitute investment advice. Trading leveraged products involves significant risk of loss. Past performance is not indicative of future results.

Share

X

Start trading today

  • Fast execution
  • Competitive spreads
  • 24/7 support
Open live accountView account types
Milton Markets
Twitter/XYouTube

Markets

FOREX
CRYPTO
COMMODITIES
INDICES
STOCKS

Trading

  • Flex Account
  • Smart Account
  • Elite Account
  • MetaTrader 5 (MT5)
  • MetaTrader 4 (MT4)
  • Launch WebTrader
  • Learn Hub
  • Economic Calendar
  • Promotions

Company

  • About Us
  • NDD Technology
  • Customer Protection
  • Execution Conditions
  • Company News
  • Blog
  • Market Analysis

Partners

  • IB Program
  • PAMM Program
  • White Label
  • Investor Login
  • Manager Login

Support

  • Terms of Service
  • Privacy Policy
  • Risk Disclosure
  • Contact Us
  • Help Center
  • My Page Login
Milton Markets is a trading name of Milton Markets Ltd. Milton Markets Ltd. is part of Milton Global and is registered in Saint Lucia (Registration Number: 2023-00166). As part of Milton Global, we adhere to the same high regulatory standards as Milton Global Ltd, which is regulated by the Seychelles Financial Services Authority (FSA) under license SD040.
Risk Warning: CFD trading carries high risk and may not suit all investors. You may lose more than your initial investment. Ensure you understand the risks before trading.
Restrictions: Milton Markets does not provide services to the following countries (not limited to these): United States, Canada, European Union countries, Iran, North Korea, Saint Vincent and the Grenadines, Afghanistan, American Samoa, Belarus, Russia, Burundi, Central African Republic, Congo (Brazzaville), Cuba, Iraq, Lebanon, Liberia, Libya, Myanmar, Puerto Rico, Rwanda, Somalia, Sudan, Syria, US Virgin Islands, Venezuela, Yemen, Zimbabwe, Côte d'Ivoire, Mali, Guinea, Eritrea.
You must be 18 years old or the legal age in your country of residence.
By opening an account, you are considered to have registered of your own volition without solicitation from Milton Markets.
Disclaimer: This website does not constitute investment advice. Content should not be construed as personal advice. Seek independent financial advice.
© 2026 Milton Markets. All rights reserved.
TermsPrivacyCookiesRisk