Milton Markets
Markets
Trading
Company
Partners
Sign InOpen Account
  1. Home/
  2. Market Analysis/
  3. Gold Falls as US GDP Exceeds Expectations【July 26, 2024】
Koki Ando•Jul 26, 2024

Gold Falls as US GDP Exceeds Expectations【July 26, 2024】

Koki Ando headshot

Daily Market Analysis

Koki AndoChief Market Analyst

Expert analysis of today's market movements and trading opportunities

Koki Ando headshot

Daily Market Analysis

Koki AndoChief Market Analyst

Expert analysis of today's market movements and trading opportunities

Fundamental Analysis

  • The US GDP exceeded expectations, reducing the anticipation of an early rate cut.
  • This has put downward pressure on gold, which is hovering around 2363 USD.
  • The USD/JPY pair rebounded from a support line at 151.94 yen and is trading in the upper 153 yen range.

XAUUSD technical analysis

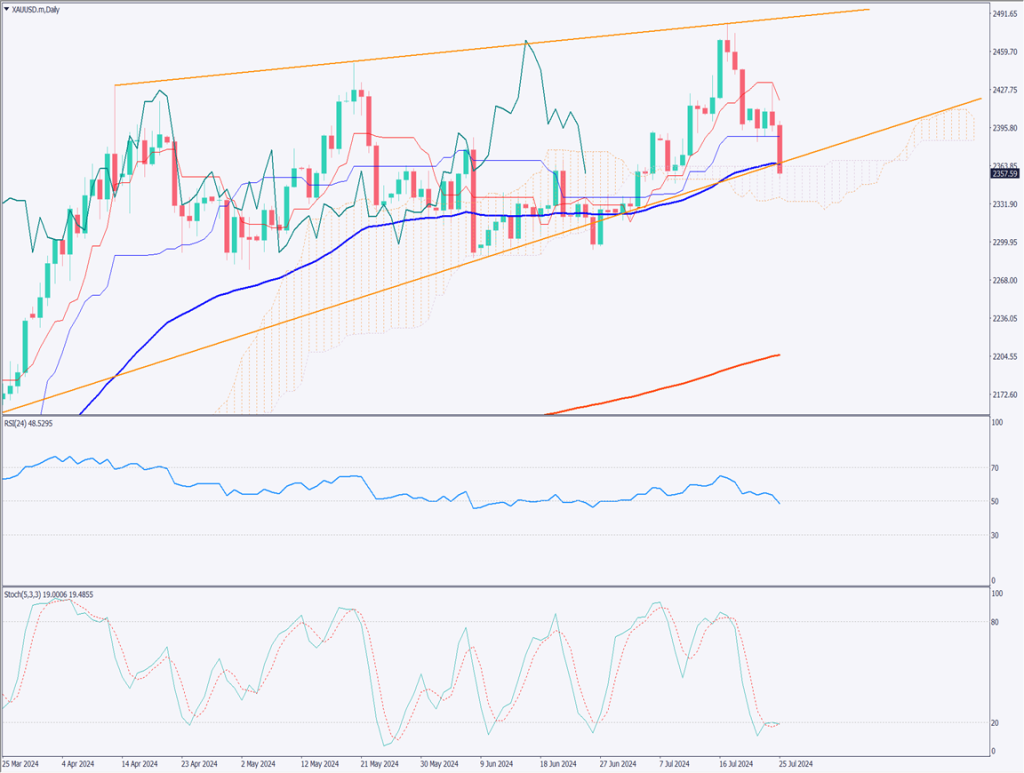
Analyzing the daily chart of gold, it appears that gold is breaking below the 52-day moving average and an ascending trend line. The better-than-expected US GDP and the fading expectations of a US rate cut have led to selling pressure on gold. Below, there is a cloud providing support, and beyond the cloud, there is the 100% line of the Fibonacci expansion. The stochastic indicator suggests that gold is in an oversold condition.

Currently, there is a noticeable decline in US stock indices, but funds are shifting from large-cap to small-cap stocks. The Russell 2000 Index, composed of small and mid-cap stocks, is rising. Gold is awaiting the next week’s FOMC meeting, where the focus will be on whether a rate cut will be decided or postponed until September. A rate cut could lead to an increase in stock prices.

[XAUUSD/ D1]

Day trading strategy (1 hour)

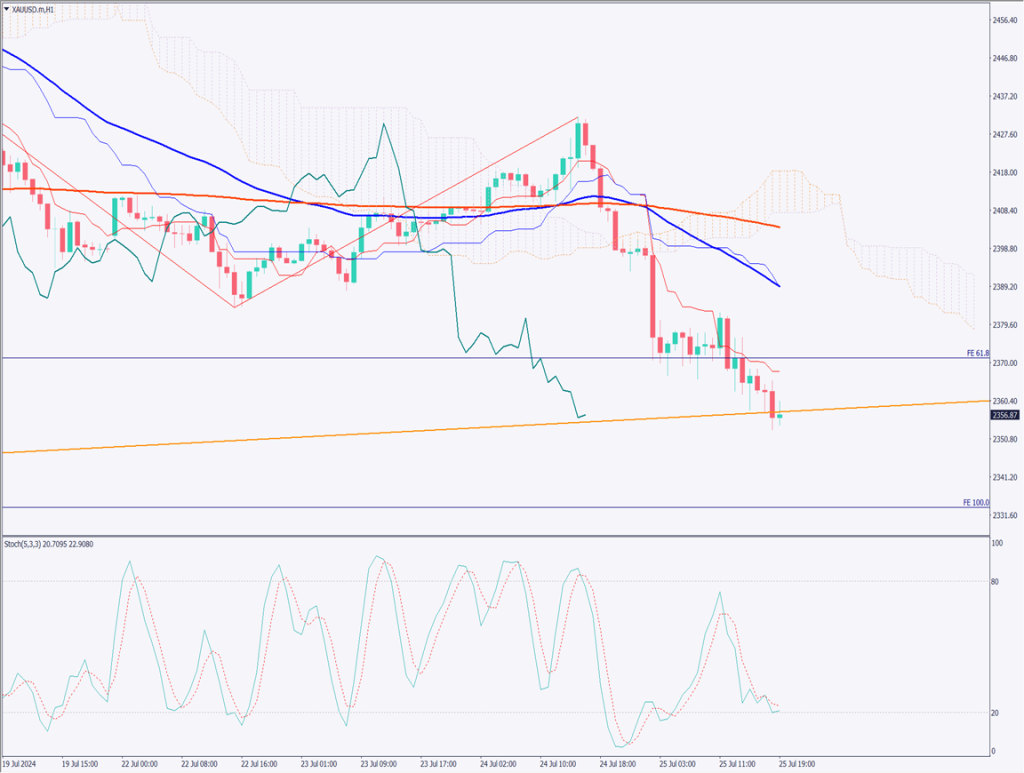
Analyzing the 1-hour chart of gold, there has been a sharp decline from around 2424 USD to approximately 2355 USD, breaking below the 61.8% level of the Fibonacci expansion at 2370 USD. There may be profit-taking actions this week due to the significant drop.

Caution is needed around the retracement to 2370 USD. If 2370 USD is confirmed to act as a resistance line, consider entering a sell position on a retracement. Entry at 2370 USD, with a target of 2335 USD, and a stop at 2375 USD.

Support/Resistance lines

Consider the following support and resistance lines:

2335 USD – Fibonacci level

2232 USD – Monthly support line

[XAUUSD/ H1]

Market Sentiment

XAUUSD Sell: 53% Buy: 47%

Featured Currency Pair of the Week (USDCHF)

The USD/CHF pair has broken below the significant support line of 0.8819 CHF and is updating its recent lows, currently trading at 0.88 CHF. A continued sell-off is expected, potentially leading to a decline to around 0.8752 CHF.

Yesterday, the US GDP exceeded market expectations, leading to increased buying of the dollar in late New York trading. With the weekend approaching, there is a higher likelihood of position adjustments, so caution is advised.

Today’s important economic indicators

Economic indicators and eventsJapan time
US Core PCE Price Index21:30
University of Michigan Inflation Expectations23:00

*Trading advice in this article is not provided by Milton Markets, but by Shu Fujiyasu Jr., a certified technical analyst.

Ready to trade?

Open live account

Related Analysis

Gold and Silver Continue to Hit Record Highs

Gold and Silver Continue to Hit Record Highs

19 days agoRead more →
Can Gold Renew Its Record High?

Can Gold Renew Its Record High?

10 days agoRead more →
USD/JPY dips slightly on LDP landslide victory

USD/JPY dips slightly on LDP landslide victory

7 days agoRead more →

This material is for informational purposes only and does not constitute investment advice. Trading leveraged products involves significant risk of loss. Past performance is not indicative of future results.

Share

X

Start trading today

  • Fast execution
  • Competitive spreads
  • 24/7 support
Open live accountView account types
Milton Markets
Twitter/XYouTube

Markets

FOREX
CRYPTO
COMMODITIES
INDICES
STOCKS

Trading

  • Flex Account
  • Smart Account
  • Elite Account
  • MetaTrader 5 (MT5)
  • MetaTrader 4 (MT4)
  • Launch WebTrader
  • Learn Hub
  • Economic Calendar
  • Promotions

Company

  • About Us
  • NDD Technology
  • Customer Protection
  • Execution Conditions
  • Company News
  • Blog
  • Market Analysis

Partners

  • IB Program
  • PAMM Program
  • White Label
  • Investor Login
  • Manager Login

Support

  • Terms of Service
  • Privacy Policy
  • Risk Disclosure
  • Contact Us
  • Help Center
  • My Page Login
Milton Markets is a trading name of Milton Markets Ltd. Milton Markets Ltd. is part of Milton Global and is registered in Saint Lucia (Registration Number: 2023-00166). As part of Milton Global, we adhere to the same high regulatory standards as Milton Global Ltd, which is regulated by the Seychelles Financial Services Authority (FSA) under license SD040.
Risk Warning: CFD trading carries high risk and may not suit all investors. You may lose more than your initial investment. Ensure you understand the risks before trading.
Restrictions: Milton Markets does not provide services to the following countries (not limited to these): United States, Canada, European Union countries, Iran, North Korea, Saint Vincent and the Grenadines, Afghanistan, American Samoa, Belarus, Russia, Burundi, Central African Republic, Congo (Brazzaville), Cuba, Iraq, Lebanon, Liberia, Libya, Myanmar, Puerto Rico, Rwanda, Somalia, Sudan, Syria, US Virgin Islands, Venezuela, Yemen, Zimbabwe, Côte d'Ivoire, Mali, Guinea, Eritrea.
You must be 18 years old or the legal age in your country of residence.
By opening an account, you are considered to have registered of your own volition without solicitation from Milton Markets.
Disclaimer: This website does not constitute investment advice. Content should not be construed as personal advice. Seek independent financial advice.
© 2026 Milton Markets. All rights reserved.
TermsPrivacyCookiesRisk