Milton Markets
Markets
Trading
Company
Partners
Sign InOpen Account
  1. Home/
  2. Market Analysis/
  3. USDJPY Falls Below 150 JPY, BOJ Decides on Additional Rate Hike【August 1, 2024】
Koki Ando•Aug 1, 2024

USDJPY Falls Below 150 JPY, BOJ Decides on Additional Rate Hike【August 1, 2024】

Koki Ando headshot

Daily Market Analysis

Koki AndoChief Market Analyst

Expert analysis of today's market movements and trading opportunities

Koki Ando headshot

Daily Market Analysis

Koki AndoChief Market Analyst

Expert analysis of today's market movements and trading opportunities

Fundamental Analysis

  • The Bank of Japan (BOJ) decided on an additional rate hike and announced a reduction in large-scale government bond purchases.
  • Fed Chair Powell made dovish remarks, suggesting a possible rate cut as early as September.

USDJPY technical analysis

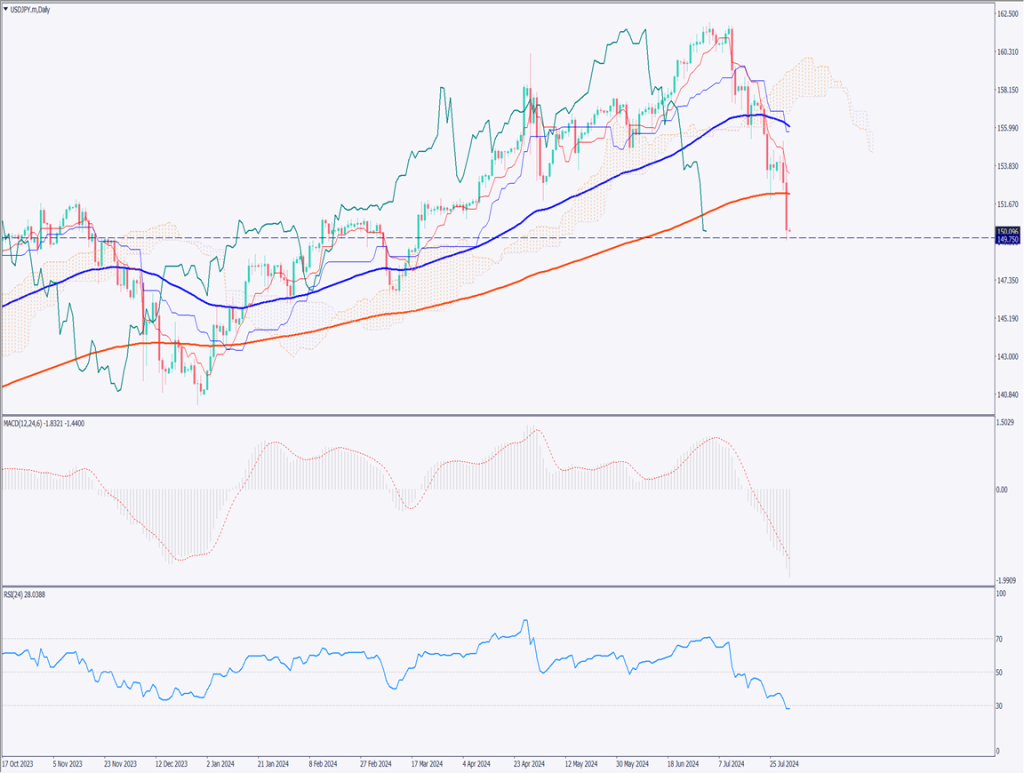
Analyzing the daily chart of USDJPY, the currency pair plunged following the BOJ’s decision to raise rates. In a press conference, the BOJ Governor reiterated hawkish comments, indicating a continued move towards rate hikes. Meanwhile, Fed Chair Powell hinted at a potential rate cut in September.

USDJPY fell below the 240-day moving average, reaching 149.75 JPY. This marks the first drop below the 240-day moving average since January 4, effectively reversing the gains made from March to early July in just about 20 days.

The RSI is at 27.8, indicating slightly oversold conditions. The MACD shows a deepening trough, suggesting a bearish trend. With the RSI at 27.8, caution is needed for potential rebounds. There is a possibility of a rebound up to around 152 JPY. Given the high volatility, any adjustment could result in significant movement.

[USDJPY/ D1]

Day trading strategy (1 hour)

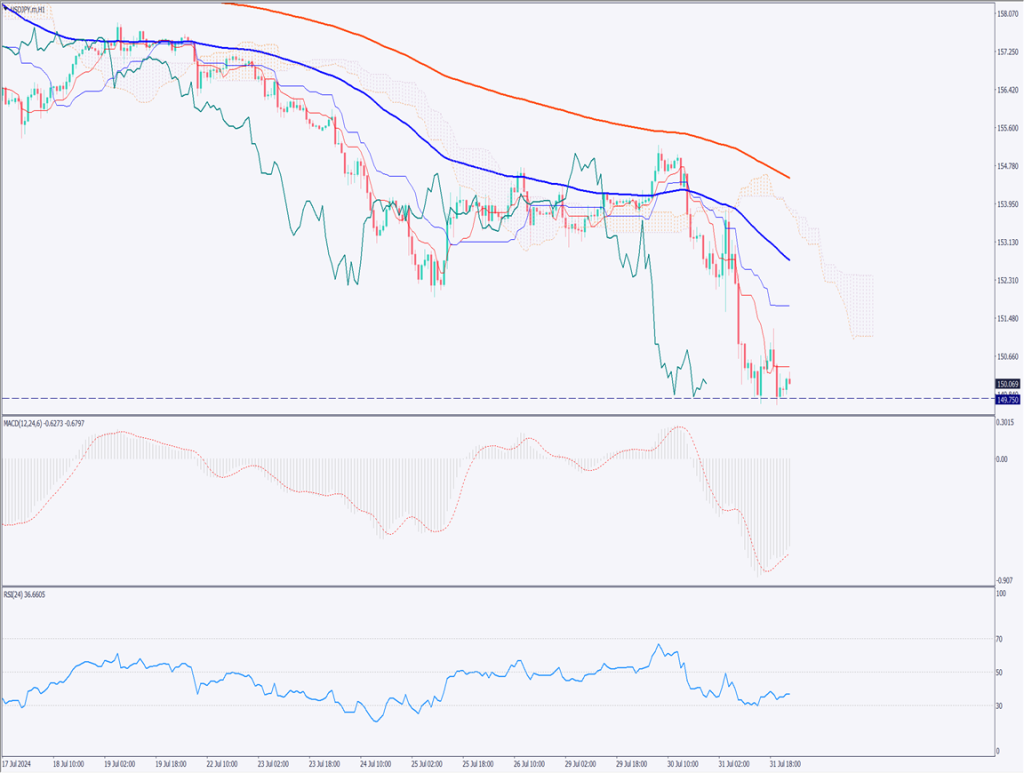
Analyzing the 1-hour chart of USDJPY, 149.75 JPY seems to be a support level. With the daily RSI in the oversold zone, profit-taking is likely. With the U.S. employment data scheduled for tomorrow, position adjustments are expected to intensify.

It’s challenging to sell in the 149 JPY range. The day trading strategy suggests selling at 151.90 JPY, with a stop at 152.15 JPY, and targeting 150.50 JPY for the settlement.

Support/Resistance lines

The following support and resistance levels should be considered going forward:

  • 148.50 JPY: Monthly support line
[USDJPY/ H1]

Market Sentiment

USDJPY: Sell: 42% Buy: 58%

Featured Currency Pair of the Week (EURAUD)

The EURAUD formed a doji with a long upper shadow. It briefly exceeded 1.67 USD but fell back near the opening price under selling pressure. The conversion line of the daily Ichimoku cloud is acting as support, but there is a possibility of breaking it today. The 1.67 USD range is strong resistance. The MACD signal line is close to crossing below the histogram. Attention should be paid to whether there will be another upward move.

Today’s important economic indicators

Economic indicators and eventsJapan time
UK Policy Announcement20:00
US Unemployment Claims21:30
US ISM Manufacturing PMI23:00

*Trading advice in this article is not provided by Milton Markets, but by Shu Fujiyasu Jr., a certified technical analyst.

Ready to trade?

Open live account

Related Analysis

Can Gold Renew Its Record High?

Can Gold Renew Its Record High?

10 days agoRead more →
No Currency Intervention Conducted; Reports of Additional Tariffs on South Korea

No Currency Intervention Conducted; Reports of Additional Tariffs on South Korea

20 days agoRead more →
USD/JPY dips slightly on LDP landslide victory

USD/JPY dips slightly on LDP landslide victory

7 days agoRead more →

This material is for informational purposes only and does not constitute investment advice. Trading leveraged products involves significant risk of loss. Past performance is not indicative of future results.

Share

X

Start trading today

  • Fast execution
  • Competitive spreads
  • 24/7 support
Open live accountView account types
Milton Markets
Twitter/XYouTube

Markets

FOREX
CRYPTO
COMMODITIES
INDICES
STOCKS

Trading

  • Flex Account
  • Smart Account
  • Elite Account
  • MetaTrader 5 (MT5)
  • MetaTrader 4 (MT4)
  • Launch WebTrader
  • Learn Hub
  • Economic Calendar
  • Promotions

Company

  • About Us
  • NDD Technology
  • Customer Protection
  • Execution Conditions
  • Company News
  • Blog
  • Market Analysis

Partners

  • IB Program
  • PAMM Program
  • White Label
  • Investor Login
  • Manager Login

Support

  • Terms of Service
  • Privacy Policy
  • Risk Disclosure
  • Contact Us
  • Help Center
  • My Page Login
Milton Markets is a trading name of Milton Markets Ltd. Milton Markets Ltd. is part of Milton Global and is registered in Saint Lucia (Registration Number: 2023-00166). As part of Milton Global, we adhere to the same high regulatory standards as Milton Global Ltd, which is regulated by the Seychelles Financial Services Authority (FSA) under license SD040.
Risk Warning: CFD trading carries high risk and may not suit all investors. You may lose more than your initial investment. Ensure you understand the risks before trading.
Restrictions: Milton Markets does not provide services to the following countries (not limited to these): United States, Canada, European Union countries, Iran, North Korea, Saint Vincent and the Grenadines, Afghanistan, American Samoa, Belarus, Russia, Burundi, Central African Republic, Congo (Brazzaville), Cuba, Iraq, Lebanon, Liberia, Libya, Myanmar, Puerto Rico, Rwanda, Somalia, Sudan, Syria, US Virgin Islands, Venezuela, Yemen, Zimbabwe, Côte d'Ivoire, Mali, Guinea, Eritrea.
You must be 18 years old or the legal age in your country of residence.
By opening an account, you are considered to have registered of your own volition without solicitation from Milton Markets.
Disclaimer: This website does not constitute investment advice. Content should not be construed as personal advice. Seek independent financial advice.
© 2026 Milton Markets. All rights reserved.
TermsPrivacyCookiesRisk