Milton Markets
Markets
Trading
Company
Partners
Sign InOpen Account
  1. Home/
  2. Market Analysis/
  3. USDJPY Experiences Sharp Decline as US Employment Report Deteriorates and Unemployment Rate Rises【August 5, 2024】
Koki Ando•Aug 5, 2024

USDJPY Experiences Sharp Decline as US Employment Report Deteriorates and Unemployment Rate Rises【August 5, 2024】

Koki Ando headshot

Daily Market Analysis

Koki AndoChief Market Analyst

Expert analysis of today's market movements and trading opportunities

Koki Ando headshot

Daily Market Analysis

Koki AndoChief Market Analyst

Expert analysis of today's market movements and trading opportunities

Fundamental Analysis

  • US Employment Report Deteriorates, Unemployment Rate Rises, Increasing Expectations for US Rate Cuts
  • USDJPY Experiences Rapid Decline, Trading Around 145 JPY
  • Japan’s Hawkish Stance vs. US Dovish Stance Favors a Stronger JPY

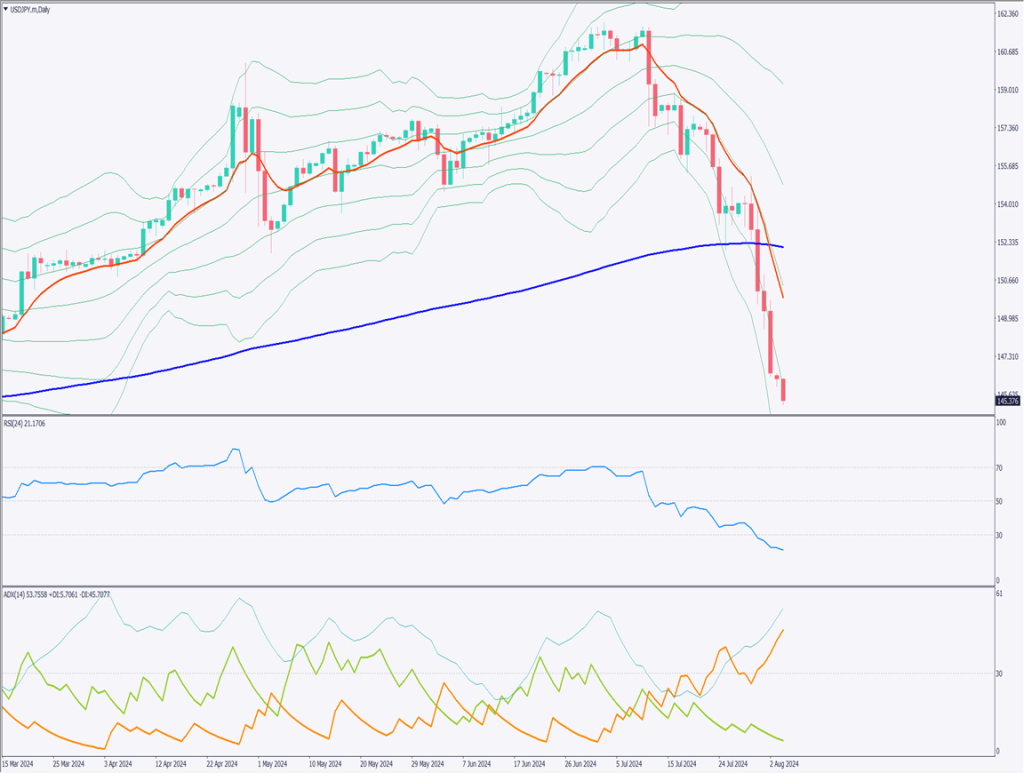
USDJPY technical analysis

Analyzing the daily chart of USDJPY. Currently trading around 145 JPY, the pair continues its rapid decline. The backdrop includes the Bank of Japan’s interest rate hike and the growing expectations for a rate cut by the US Federal Reserve, narrowing the US-Japan interest rate differential. The rise in the US unemployment rate has triggered recession signals. With Japan and US interest rate policies moving in opposite directions, there is a greater-than-expected risk of JPY appreciation, reversing the previous JPY depreciation trend.

The RSI stands at 21.4, lower than the 27.4 level seen during the COVID-19 shock, indicating a sharper decline towards JPY appreciation compared to the COVID period.

Looking ahead, the 140 JPY level could serve as a benchmark. Sufficient caution against further JPY appreciation risk is necessary.

[USDJPY/ D1]

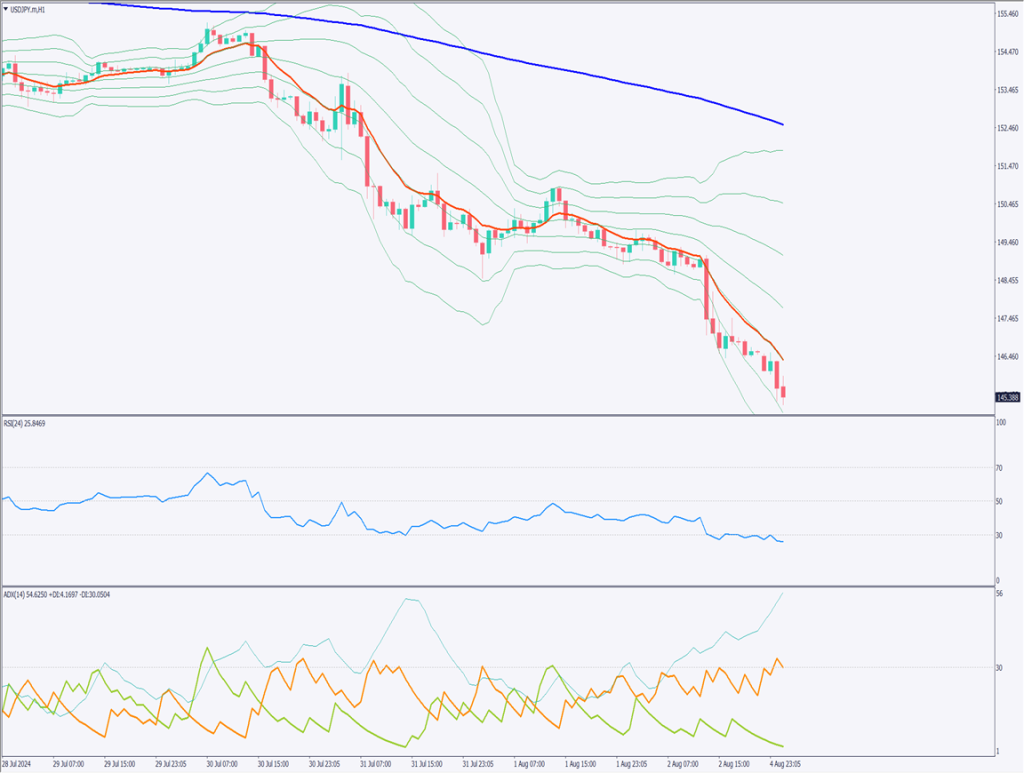
Day trading strategy (1 hour)

On the 1-hour chart of USDJPY, a downtrend is also evident. The RSI stands at 27, remaining below 30. From a 1-hour chart perspective, a temporary rebound can be expected. The market seems slightly oversold, indicating a sense of panic. Even during the JPY depreciation trend, there were repeated movements up and down.

On the 1-hour chart, it is expected to adjust back to around 148.5 JPY.

The day trading strategy is to aim for a rebound sell. It would be ideal to sell once the price pulls back to around 148.5 JPY. The ultimate goal is around 140 JPY, but positions will be settled if the price reaches 145 JPY. A stop should be placed if the price exceeds 149.5 JPY.

Support/Resistance lines

The following support and resistance lines should be considered in the future:

  • 148.19 JPY .. Fibonacci Level
[USDJPY/ H1]

Market Sentiment

USDJPY: Sell: 57%, Buy: 43%

Today’s important economic indicators

Economic indicators and eventsJapan time
Bank of Japan Monetary Policy Meeting Minutes8:50 AM
US ISM Services PMI10:45 PM
US ISM Non-Manufacturing Index11:00 PM

*Trading advice in this article is not provided by Milton Markets, but by Shu Fujiyasu Jr., a certified technical analyst.

Ready to trade?

Open live account

Related Analysis

No Currency Intervention Conducted; Reports of Additional Tariffs on South Korea

No Currency Intervention Conducted; Reports of Additional Tariffs on South Korea

20 days agoRead more →
USD/JPY Forms a Range — What’s Next?

USD/JPY Forms a Range — What’s Next?

TodayRead more →
USD/JPY: Selling Pressure Dominates on Rallies

USD/JPY: Selling Pressure Dominates on Rallies

6 days agoRead more →

This material is for informational purposes only and does not constitute investment advice. Trading leveraged products involves significant risk of loss. Past performance is not indicative of future results.

Share

X

Start trading today

  • Fast execution
  • Competitive spreads
  • 24/7 support
Open live accountView account types
Milton Markets
Twitter/XYouTube

Markets

FOREX
CRYPTO
COMMODITIES
INDICES
STOCKS

Trading

  • Flex Account
  • Smart Account
  • Elite Account
  • MetaTrader 5 (MT5)
  • MetaTrader 4 (MT4)
  • Launch WebTrader
  • Learn Hub
  • Economic Calendar
  • Promotions

Company

  • About Us
  • NDD Technology
  • Customer Protection
  • Execution Conditions
  • Company News
  • Blog
  • Market Analysis

Partners

  • IB Program
  • PAMM Program
  • White Label
  • Investor Login
  • Manager Login

Support

  • Terms of Service
  • Privacy Policy
  • Risk Disclosure
  • Contact Us
  • Help Center
  • My Page Login
Milton Markets is a trading name of Milton Markets Ltd. Milton Markets Ltd. is part of Milton Global and is registered in Saint Lucia (Registration Number: 2023-00166). As part of Milton Global, we adhere to the same high regulatory standards as Milton Global Ltd, which is regulated by the Seychelles Financial Services Authority (FSA) under license SD040.
Risk Warning: CFD trading carries high risk and may not suit all investors. You may lose more than your initial investment. Ensure you understand the risks before trading.
Restrictions: Milton Markets does not provide services to the following countries (not limited to these): United States, Canada, European Union countries, Iran, North Korea, Saint Vincent and the Grenadines, Afghanistan, American Samoa, Belarus, Russia, Burundi, Central African Republic, Congo (Brazzaville), Cuba, Iraq, Lebanon, Liberia, Libya, Myanmar, Puerto Rico, Rwanda, Somalia, Sudan, Syria, US Virgin Islands, Venezuela, Yemen, Zimbabwe, Côte d'Ivoire, Mali, Guinea, Eritrea.
You must be 18 years old or the legal age in your country of residence.
By opening an account, you are considered to have registered of your own volition without solicitation from Milton Markets.
Disclaimer: This website does not constitute investment advice. Content should not be construed as personal advice. Seek independent financial advice.
© 2026 Milton Markets. All rights reserved.
TermsPrivacyCookiesRisk