Milton Markets
Markets
Trading
Company
Partners
Sign InOpen Account
  1. Home/
  2. Market Analysis/
  3. USDJPY Temporarily Around 140 JPY, Nikkei Average Records Largest Drop【August 6, 2024】
Koki Ando•Aug 6, 2024

USDJPY Temporarily Around 140 JPY, Nikkei Average Records Largest Drop【August 6, 2024】

Koki Ando headshot

Daily Market Analysis

Koki AndoChief Market Analyst

Expert analysis of today's market movements and trading opportunities

Koki Ando headshot

Daily Market Analysis

Koki AndoChief Market Analyst

Expert analysis of today's market movements and trading opportunities

Fundamental Analysis

  • The Nikkei Average recorded its largest drop, temporarily down 8,000 JPY.
  • USDJPY fell to 140 JPY, indicating a possible selling climax.
  • Market movements are factoring in the expectation of a US interest rate cut.

USDJPY technical analysis

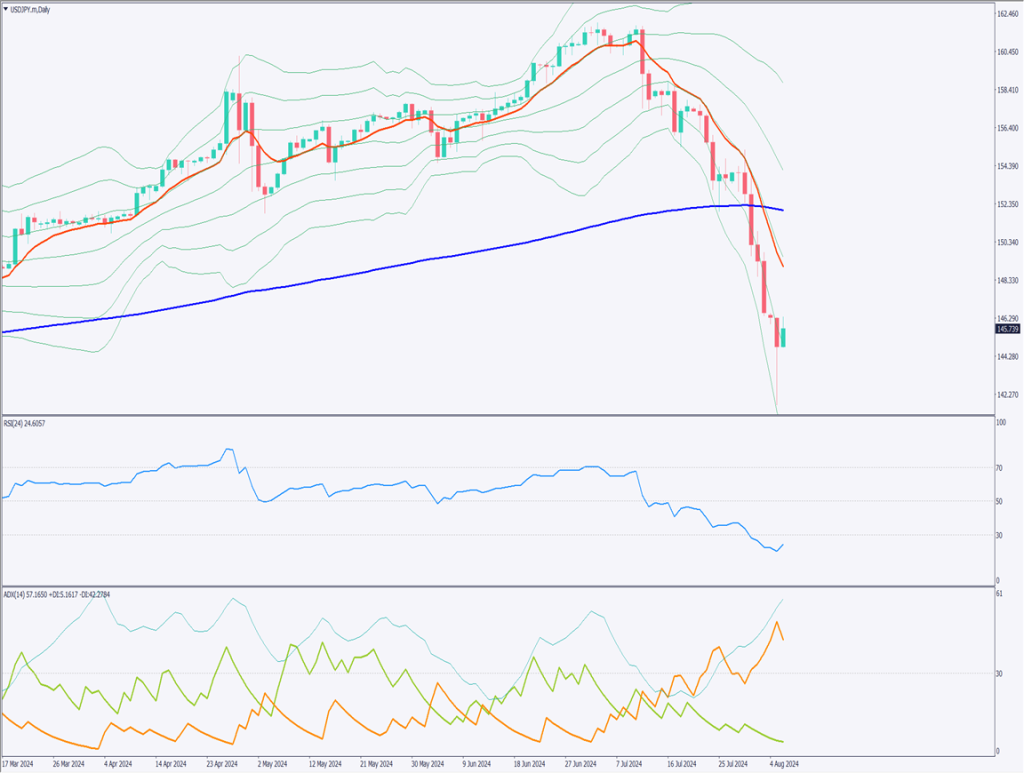
Analyze the daily USDJPY chart. USDJPY fell to the 141 JPY level, and the RSI dropped to 21. Following positive US ISM Non-Manufacturing Index data, it recovered to 145 JPY. It is possible to consider that it rebounded at the -3σ line of the Bollinger Bands.

Although the ADX indicates a strengthening downward trend, there is a high possibility of a corrective rebound. In the presence of a strong trend, the 10-day moving average serves as a reference. Since the 10-day moving average is around 149 JPY, it is possible that it could quickly rebound to around 148 JPY.

It is a situation where you want to aim for a sell on the rebound.

[USDJPY/ D1]

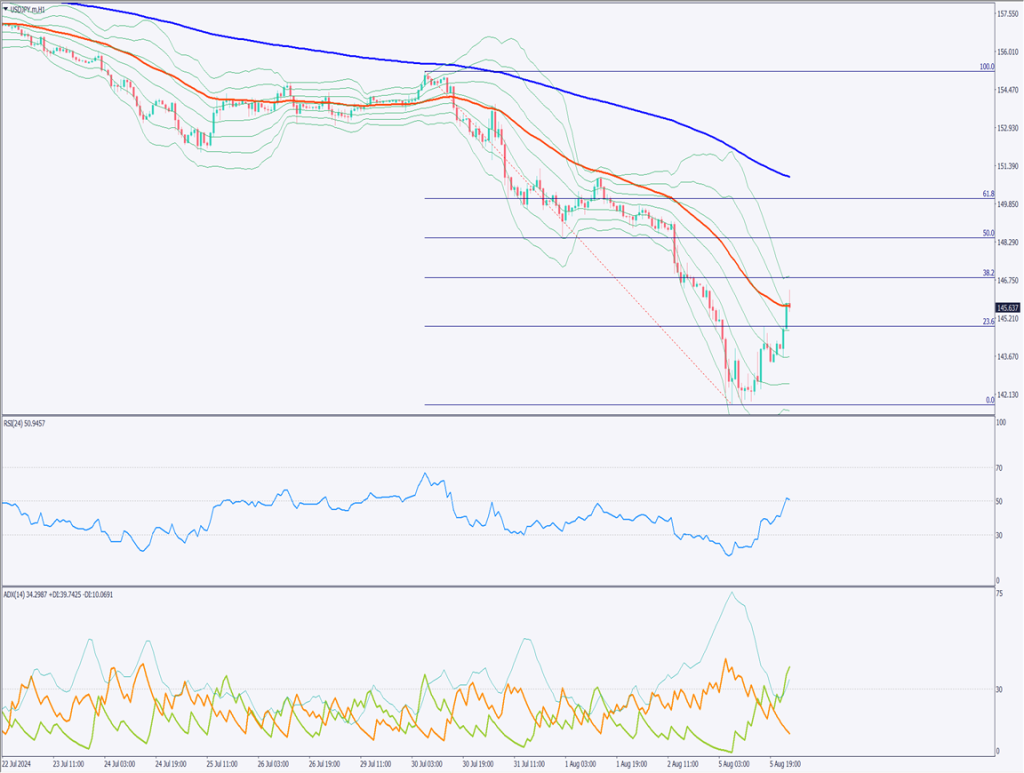
Day trading strategy (1 hour)

Analyze the 1-hour USDJPY chart. The 52-period moving average is a reference on the 1-hour chart. After falling to the 141 JPY level, it has returned to 145 JPY. Typically, this represents a terrifying level of volatility. Looking at the ATR on the 1-hour chart, the 12-period (half-day) average volatility is 90 pips.

Risk management should be more stringent than usual.

While the yen’s appreciation trend remains unchanged, it’s best to avoid easy sell entries. Consider entering around 145.50 JPY where the 52-period moving average is trending, setting a stop at 146.80 JPY and closing at 143.60 JPY.

Support/Resistance lines

The support and resistance lines to consider moving forward are as follows:

141.70 JPY – Recent low

140.18 JPY – Previous low

[USDJPY/ H1]

Market Sentiment

USDJPY: Sell: 44% Buy: 56%

Featured Currency Pair of the Week (AUDNZD)

Analyze the Australian Dollar/New Zealand Dollar. Due to the impact of the global simultaneous stock market decline, volatility is greater than usual. However, since the Australian Dollar and New Zealand Dollar tend to move similarly, a strong trend is unlikely to develop in this currency pair.

Today, the Australian Dollar’s policy interest rate will be announced. If there is a surprise in the policy interest rate, the Australian Dollar may be temporarily sold off. AUDNZD has rebounded at the 200-day moving average.

Today’s important economic indicators

Economic indicators and eventsJapan time
Japanese Household Survey and Consumption Expenditure8:30
Australian Policy Interest Rate13:30

*Trading advice in this article is not provided by Milton Markets, but by Shu Fujiyasu Jr., a certified technical analyst.

Ready to trade?

Open live account

Related Analysis

USD/JPY dips slightly on LDP landslide victory

USD/JPY dips slightly on LDP landslide victory

7 days agoRead more →
Can Gold Renew Its Record High?

Can Gold Renew Its Record High?

10 days agoRead more →
USD/JPY Forms a Range — What’s Next?

USD/JPY Forms a Range — What’s Next?

TodayRead more →

This material is for informational purposes only and does not constitute investment advice. Trading leveraged products involves significant risk of loss. Past performance is not indicative of future results.

Share

X

Start trading today

  • Fast execution
  • Competitive spreads
  • 24/7 support
Open live accountView account types
Milton Markets
Twitter/XYouTube

Markets

FOREX
CRYPTO
COMMODITIES
INDICES
STOCKS

Trading

  • Flex Account
  • Smart Account
  • Elite Account
  • MetaTrader 5 (MT5)
  • MetaTrader 4 (MT4)
  • Launch WebTrader
  • Learn Hub
  • Economic Calendar
  • Promotions

Company

  • About Us
  • NDD Technology
  • Customer Protection
  • Execution Conditions
  • Company News
  • Blog
  • Market Analysis

Partners

  • IB Program
  • PAMM Program
  • White Label
  • Investor Login
  • Manager Login

Support

  • Terms of Service
  • Privacy Policy
  • Risk Disclosure
  • Contact Us
  • Help Center
  • My Page Login
Milton Markets is a trading name of Milton Markets Ltd. Milton Markets Ltd. is part of Milton Global and is registered in Saint Lucia (Registration Number: 2023-00166). As part of Milton Global, we adhere to the same high regulatory standards as Milton Global Ltd, which is regulated by the Seychelles Financial Services Authority (FSA) under license SD040.
Risk Warning: CFD trading carries high risk and may not suit all investors. You may lose more than your initial investment. Ensure you understand the risks before trading.
Restrictions: Milton Markets does not provide services to the following countries (not limited to these): United States, Canada, European Union countries, Iran, North Korea, Saint Vincent and the Grenadines, Afghanistan, American Samoa, Belarus, Russia, Burundi, Central African Republic, Congo (Brazzaville), Cuba, Iraq, Lebanon, Liberia, Libya, Myanmar, Puerto Rico, Rwanda, Somalia, Sudan, Syria, US Virgin Islands, Venezuela, Yemen, Zimbabwe, Côte d'Ivoire, Mali, Guinea, Eritrea.
You must be 18 years old or the legal age in your country of residence.
By opening an account, you are considered to have registered of your own volition without solicitation from Milton Markets.
Disclaimer: This website does not constitute investment advice. Content should not be construed as personal advice. Seek independent financial advice.
© 2026 Milton Markets. All rights reserved.
TermsPrivacyCookiesRisk