Milton Markets
Markets
Trading
Company
Partners
Sign InOpen Account
  1. Home/
  2. Market Analysis/
  3. Stock Indices Rebound Strongly as US Rate Cut Expectations Rise, Gold Declines【August 7, 2024】
Koki Ando•Aug 7, 2024

Stock Indices Rebound Strongly as US Rate Cut Expectations Rise, Gold Declines【August 7, 2024】

Koki Ando headshot

Daily Market Analysis

Koki AndoChief Market Analyst

Expert analysis of today's market movements and trading opportunities

Koki Ando headshot

Daily Market Analysis

Koki AndoChief Market Analyst

Expert analysis of today's market movements and trading opportunities

Fundamental Analysis

  • Stock indices rebounded significantly, with the Nikkei 225 seeing its largest increase ever.
  • The stock market continues to fluctuate, with few notable economic indicators this week.
  • Gold has not risen as rate cut expectations are gradually being priced in.

XAUUSD technical analysis

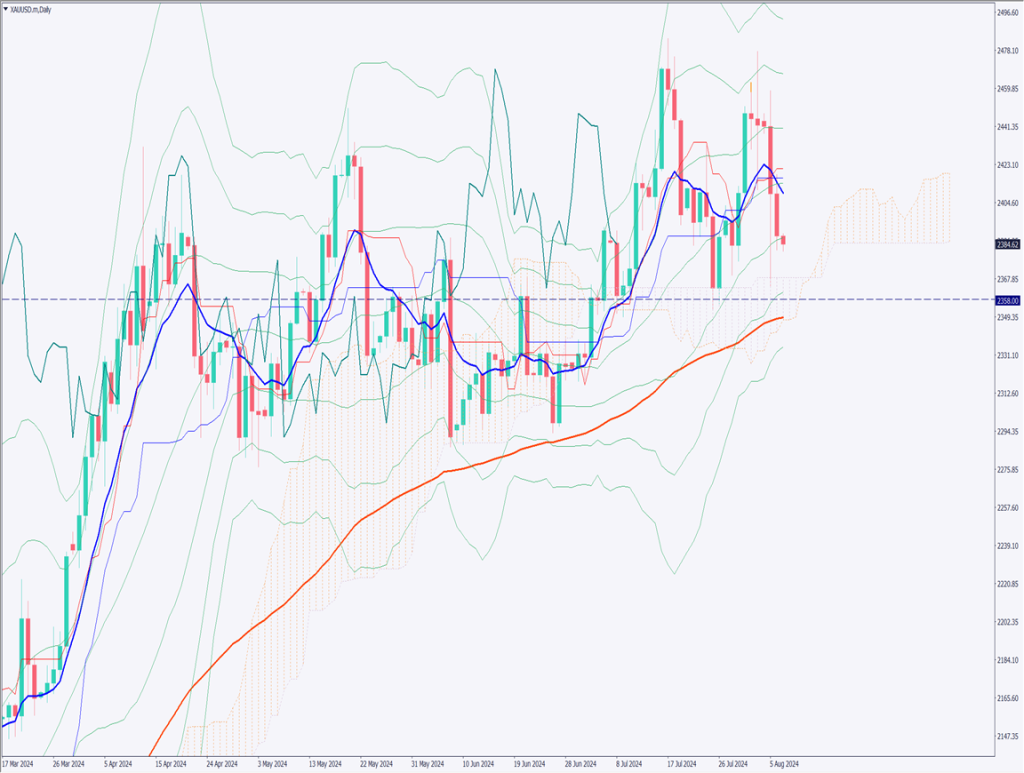
Analyzing the daily chart of gold, we see that it has fallen below the middle line of the Bollinger Bands. The target is the upper limit of the Ichimoku Cloud. There is also strong support at 2358USD, making the range from 2358USD to 2368USD appear relatively firm.

Gold is currently distanced from the 10-day moving average, with the lagging span about to fall below the candlesticks. Downward pressure is likely to continue.

[XAUUSD/ D1]

Day trading strategy (1 hour)

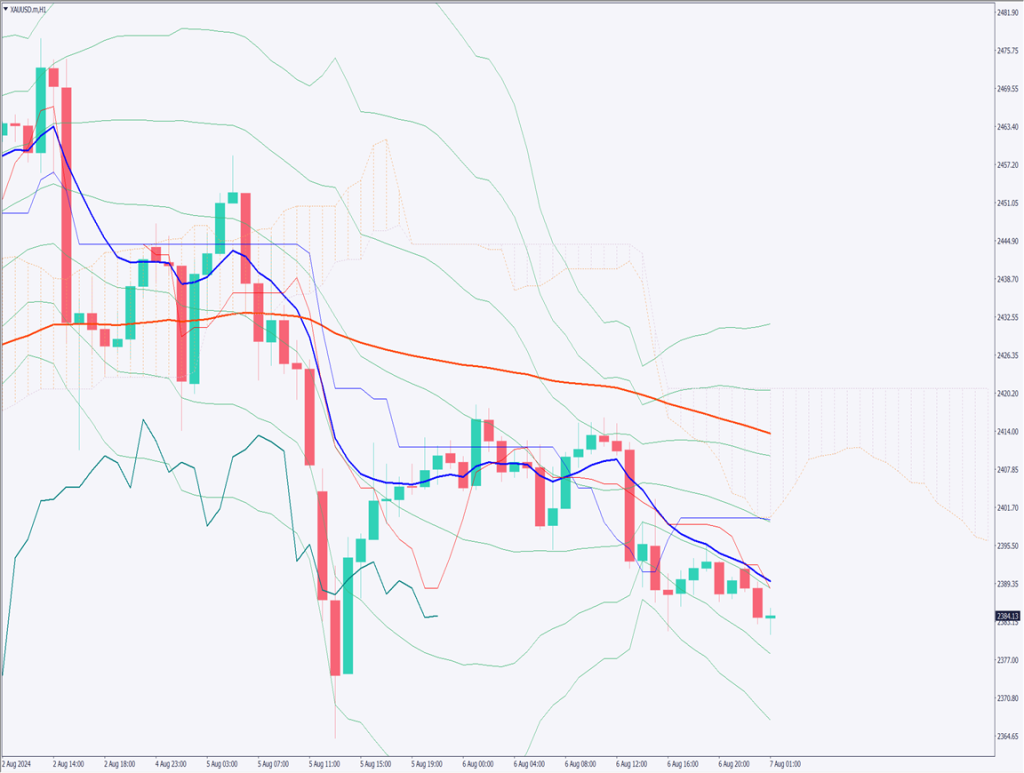
On the 1-hour chart for gold, the 90-period moving average is showing a gradual downward trend, as is the 10-period moving average. Additionally, the conversion line is also declining, suggesting a possible drop to around 2364USD.

For day trading, I would consider picking up any dips. Although it’s a bit deep, I would buy at 2358USD, set a stop at 2350USD, and aim for a take profit at 2375USD.

Support/Resistance lines

The support and resistance levels to consider moving forward are as follows:

  • 2364USD: Recent low
[XAUUSD/ H1]

Market Sentiment

XAUUSD: Sell: 57%, Buy: 43%

Featured Currency Pair of the Week (AUDNZD)

The AUDNZD pair has formed a long upper shadow and declined, exhibiting a typical “three black crows” pattern. Currently, the daily chart is moving within the cloud, and it may become somewhat unstable until it breaks out of the cloud. If it falls below 1.09USD, it may aim for around 1.085USD. As the Bollinger Bands are moving near the -2σ line, caution is needed for any correction movements.

Today’s important economic indicators

Economic indicators and eventsJapan time
Crude Oil Inventories23:30

*Trading advice in this article is not provided by Milton Markets, but by Shu Fujiyasu Jr., a certified technical analyst.

Ready to trade?

Open live account

Related Analysis

USD/JPY dips slightly on LDP landslide victory

USD/JPY dips slightly on LDP landslide victory

7 days agoRead more →
USD/JPY: Selling Pressure Dominates on Rallies

USD/JPY: Selling Pressure Dominates on Rallies

6 days agoRead more →
Gold and Silver Continue to Hit Record Highs

Gold and Silver Continue to Hit Record Highs

19 days agoRead more →

This material is for informational purposes only and does not constitute investment advice. Trading leveraged products involves significant risk of loss. Past performance is not indicative of future results.

Share

X

Start trading today

  • Fast execution
  • Competitive spreads
  • 24/7 support
Open live accountView account types
Milton Markets
Twitter/XYouTube

Markets

FOREX
CRYPTO
COMMODITIES
INDICES
STOCKS

Trading

  • Flex Account
  • Smart Account
  • Elite Account
  • MetaTrader 5 (MT5)
  • MetaTrader 4 (MT4)
  • Launch WebTrader
  • Learn Hub
  • Economic Calendar
  • Promotions

Company

  • About Us
  • NDD Technology
  • Customer Protection
  • Execution Conditions
  • Company News
  • Blog
  • Market Analysis

Partners

  • IB Program
  • PAMM Program
  • White Label
  • Investor Login
  • Manager Login

Support

  • Terms of Service
  • Privacy Policy
  • Risk Disclosure
  • Contact Us
  • Help Center
  • My Page Login
Milton Markets is a trading name of Milton Markets Ltd. Milton Markets Ltd. is part of Milton Global and is registered in Saint Lucia (Registration Number: 2023-00166). As part of Milton Global, we adhere to the same high regulatory standards as Milton Global Ltd, which is regulated by the Seychelles Financial Services Authority (FSA) under license SD040.
Risk Warning: CFD trading carries high risk and may not suit all investors. You may lose more than your initial investment. Ensure you understand the risks before trading.
Restrictions: Milton Markets does not provide services to the following countries (not limited to these): United States, Canada, European Union countries, Iran, North Korea, Saint Vincent and the Grenadines, Afghanistan, American Samoa, Belarus, Russia, Burundi, Central African Republic, Congo (Brazzaville), Cuba, Iraq, Lebanon, Liberia, Libya, Myanmar, Puerto Rico, Rwanda, Somalia, Sudan, Syria, US Virgin Islands, Venezuela, Yemen, Zimbabwe, Côte d'Ivoire, Mali, Guinea, Eritrea.
You must be 18 years old or the legal age in your country of residence.
By opening an account, you are considered to have registered of your own volition without solicitation from Milton Markets.
Disclaimer: This website does not constitute investment advice. Content should not be construed as personal advice. Seek independent financial advice.
© 2026 Milton Markets. All rights reserved.
TermsPrivacyCookiesRisk