Milton Markets
Markets
Trading
Company
Partners
Sign InOpen Account
  1. Home/
  2. Market Analysis/
  3. Can EURUSD Break Above, Pending US Unemployment Claims Data Release【August 8, 2024】
Koki Ando•Aug 8, 2024

Can EURUSD Break Above, Pending US Unemployment Claims Data Release【August 8, 2024】

Koki Ando headshot

Daily Market Analysis

Koki AndoChief Market Analyst

Expert analysis of today's market movements and trading opportunities

Koki Ando headshot

Daily Market Analysis

Koki AndoChief Market Analyst

Expert analysis of today's market movements and trading opportunities

Fundamental Analysis

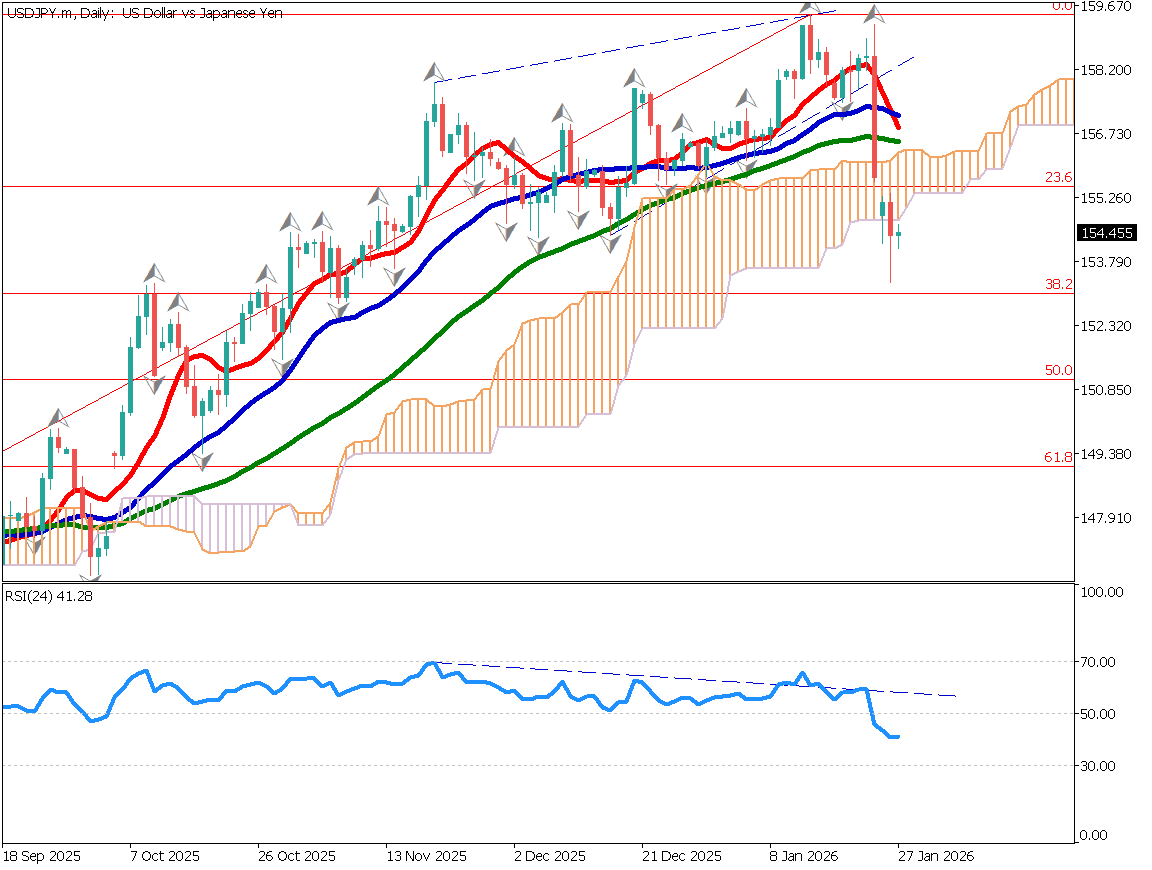
  • BoJ Deputy Governor’s Dovish Comments Push USDJPY to Late 147 Yen Range
  • The BoJ Deputy Governor stated that there will be no rate hikes in an unstable market condition
  • Nikkei 225 Pressured by Selling but Continues Two-Day Rise

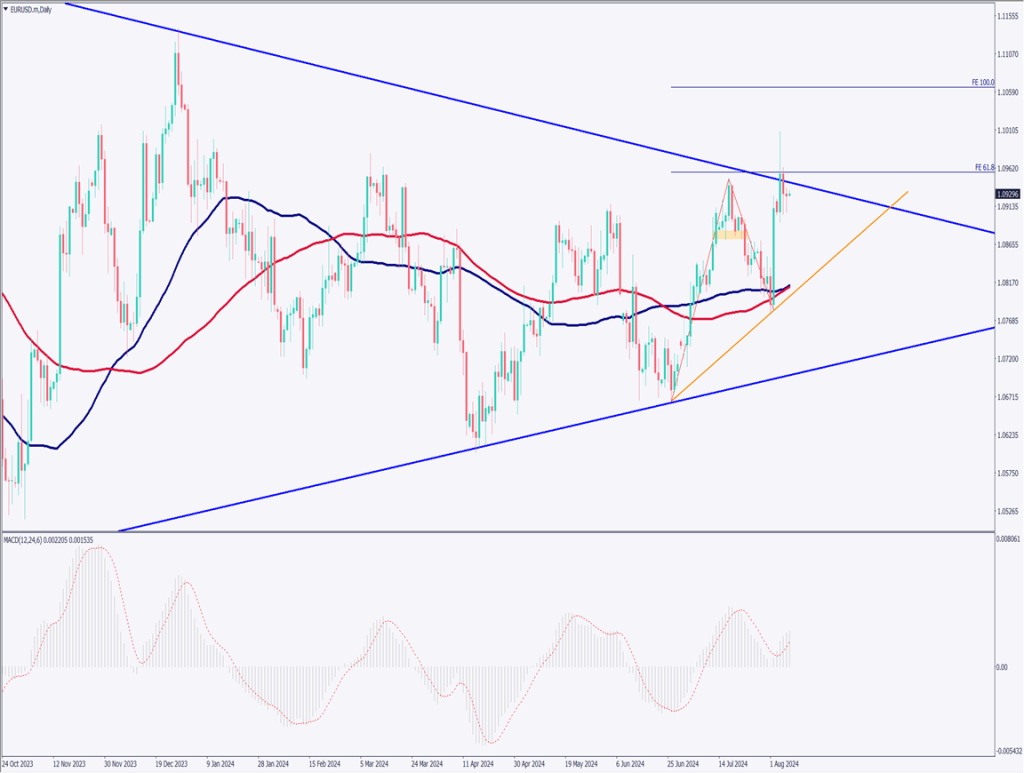
EURUSD technical analysis

Analyzing the daily chart of EURUSD. After surpassing the recent high, EURUSD retraced but showed strong buying pressure with the appearance of a long lower shadow candlestick. Drawing Fibonacci expansion, 61.8% corresponds to 1.095 USD and 100% to 1.105 USD.

1.10 USD is a round number, so it may take time to break above. MACD suggests an upward trend. On a larger perspective, it is forming a triangle, and whether it can break above this triangle is also a key point.

[EURUSD/ D1]

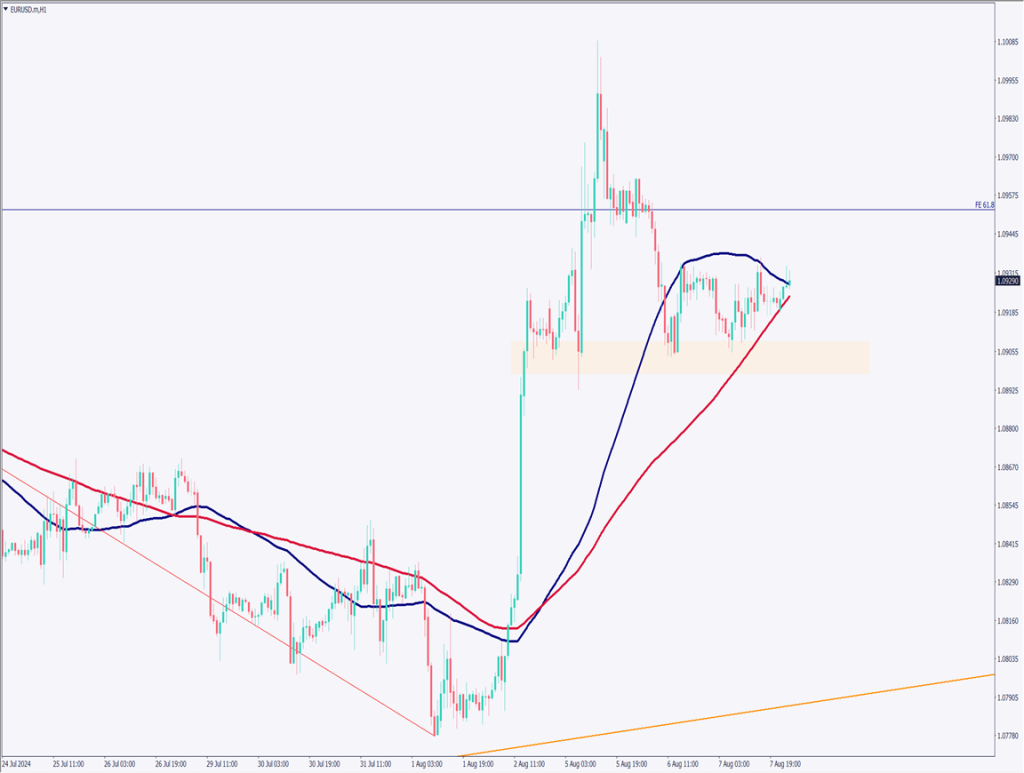
Day trading strategy (1 hour)

Analyzing the 1-hour chart of EURUSD. It is supported by the 90 moving average and rising. Confirming the firmness around 1.09 USD, it appears to have a slightly bullish outlook. However, if it breaks below the 90 moving average, it could fall to around 1.0865 USD, which corresponds to 61.8% of the recent uptrend.

Today’s day trading policy is to buy the dip. If there is a deep correction to around 1.0870 USD, consider buying. Stop if it falls below 1.085 USD. Take profit at 1.098 USD.

Support/Resistance lines

Consider the following support and resistance lines going forward:

Recent high: 1.1008 USD

[EURUSD/ H1]

Market Sentiment

EURUSD Sell: 71% Buy: 29%

Featured Currency Pair of the Week (AUDNZD)

AUDNZD has been declining for two consecutive days. It has fallen below 1.09 USD and is hovering around 1.087 USD. It is believed to be heading towards the recent low of 1.085 USD. Until July, AUD was easier to buy, but now the market seems to favor NZD. As the 200-day moving average is around 1.085 USD, buying the dip might occur below 1.085 USD.

Today’s important economic indicators

Economic indicators and eventsJapan time
US Unemployment Claims21:30

*Trading advice in this article is not provided by Milton Markets, but by Shu Fujiyasu Jr., a certified technical analyst.

Ready to trade?

Open live account

Related Analysis

USD/JPY Forms a Range — What’s Next?

USD/JPY Forms a Range — What’s Next?

TodayRead more →
No Currency Intervention Conducted; Reports of Additional Tariffs on South Korea

No Currency Intervention Conducted; Reports of Additional Tariffs on South Korea

20 days agoRead more →
USD/JPY: Selling Pressure Dominates on Rallies

USD/JPY: Selling Pressure Dominates on Rallies

6 days agoRead more →

This material is for informational purposes only and does not constitute investment advice. Trading leveraged products involves significant risk of loss. Past performance is not indicative of future results.

Share

X

Start trading today

  • Fast execution
  • Competitive spreads
  • 24/7 support
Open live accountView account types
Milton Markets
Twitter/XYouTube

Markets

FOREX
CRYPTO
COMMODITIES
INDICES
STOCKS

Trading

  • Flex Account
  • Smart Account
  • Elite Account
  • MetaTrader 5 (MT5)
  • MetaTrader 4 (MT4)
  • Launch WebTrader
  • Learn Hub
  • Economic Calendar
  • Promotions

Company

  • About Us
  • NDD Technology
  • Customer Protection
  • Execution Conditions
  • Company News
  • Blog
  • Market Analysis

Partners

  • IB Program
  • PAMM Program
  • White Label
  • Investor Login
  • Manager Login

Support

  • Terms of Service
  • Privacy Policy
  • Risk Disclosure
  • Contact Us
  • Help Center
  • My Page Login
Milton Markets is a trading name of Milton Markets Ltd. Milton Markets Ltd. is part of Milton Global and is registered in Saint Lucia (Registration Number: 2023-00166). As part of Milton Global, we adhere to the same high regulatory standards as Milton Global Ltd, which is regulated by the Seychelles Financial Services Authority (FSA) under license SD040.
Risk Warning: CFD trading carries high risk and may not suit all investors. You may lose more than your initial investment. Ensure you understand the risks before trading.
Restrictions: Milton Markets does not provide services to the following countries (not limited to these): United States, Canada, European Union countries, Iran, North Korea, Saint Vincent and the Grenadines, Afghanistan, American Samoa, Belarus, Russia, Burundi, Central African Republic, Congo (Brazzaville), Cuba, Iraq, Lebanon, Liberia, Libya, Myanmar, Puerto Rico, Rwanda, Somalia, Sudan, Syria, US Virgin Islands, Venezuela, Yemen, Zimbabwe, Côte d'Ivoire, Mali, Guinea, Eritrea.
You must be 18 years old or the legal age in your country of residence.
By opening an account, you are considered to have registered of your own volition without solicitation from Milton Markets.
Disclaimer: This website does not constitute investment advice. Content should not be construed as personal advice. Seek independent financial advice.
© 2026 Milton Markets. All rights reserved.
TermsPrivacyCookiesRisk