Milton Markets
Markets
Trading
Company
Partners
Sign InOpen Account
  1. Home/
  2. Market Analysis/
  3. USDJPY Rises as U.S. Jobless Claims Decrease【August 9, 2024】
Koki Ando•Aug 9, 2024

USDJPY Rises as U.S. Jobless Claims Decrease【August 9, 2024】

Koki Ando headshot

Daily Market Analysis

Koki AndoChief Market Analyst

Expert analysis of today's market movements and trading opportunities

Koki Ando headshot

Daily Market Analysis

Koki AndoChief Market Analyst

Expert analysis of today's market movements and trading opportunities

Fundamental Analysis

  • The RBA Governor Comments on Unwillingness to Hike Rates; AUD Surges
  • USDJPY Rises to 147.80 JPY, with the 10-Day Moving Average Acting as Resistance

USDJPY technical analysis

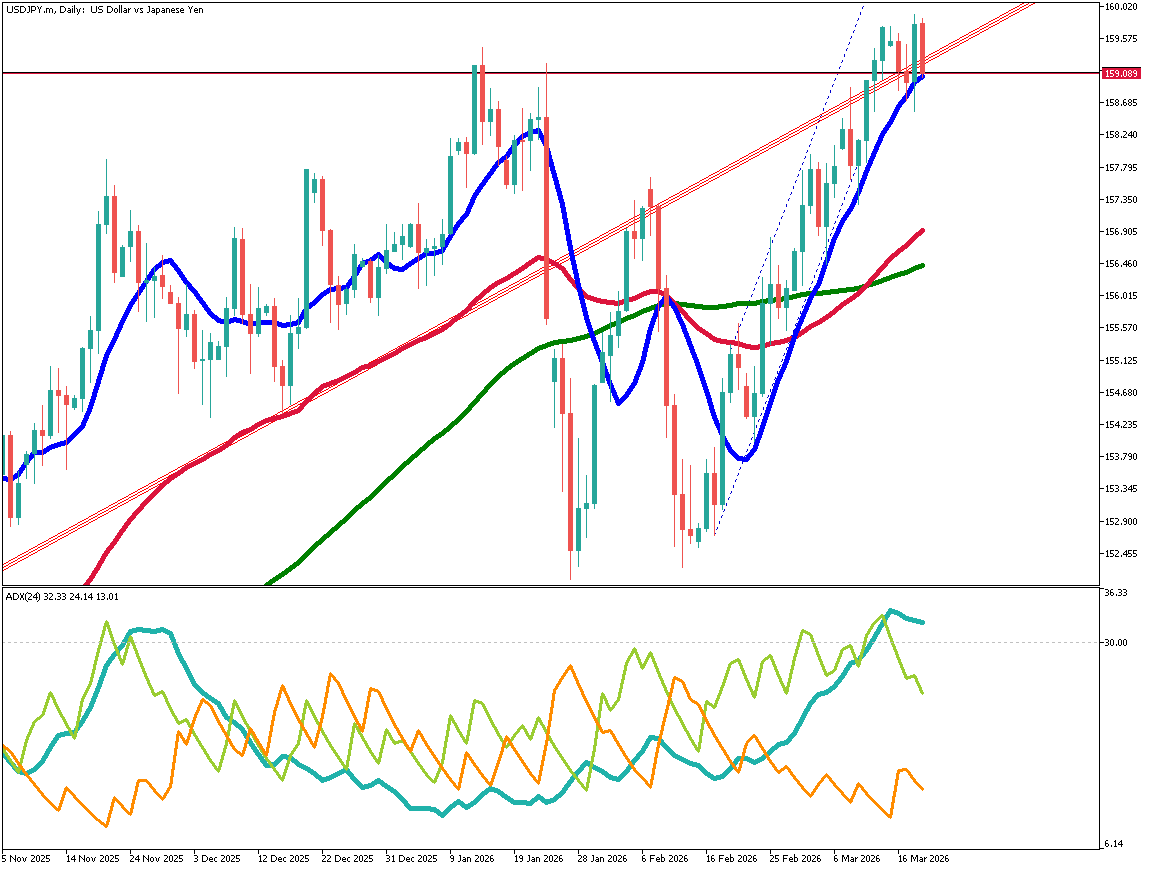
Analyzing the USDJPY daily chart, USDJPY has risen from the 141 JPY level to 147.80 JPY, with a 500-pip drop and a 600-pip rise just this week. The market exhibits extremely high volatility and is highly unstable. When a strong trend is present, the 10-day moving average serves as a reference.

Whether USDJPY can break above the 10-day moving average will be one factor in determining whether this is a temporary rebound or a signal of bottoming out and rising. Although the Bank of Japan stated that it would not raise rates in the current unstable environment, there is still a possibility of a rate hike if the market stabilizes.

The yen’s appreciation trend has not reversed.

[USDJPY/ D1]

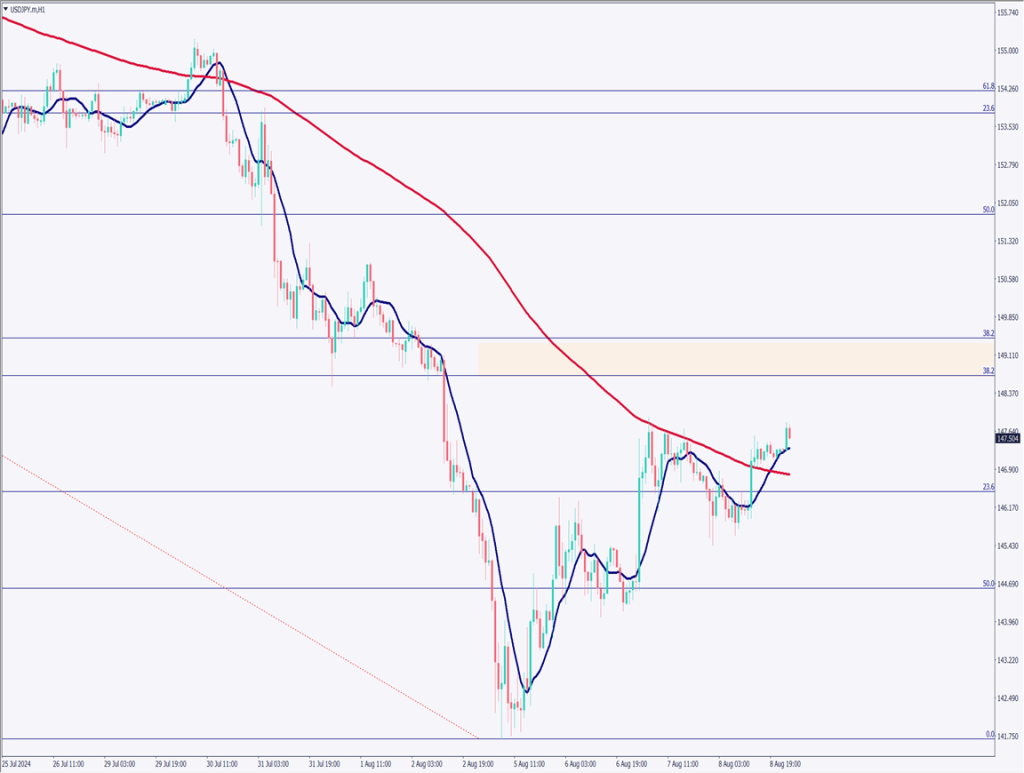
Day trading strategy (1 hour)

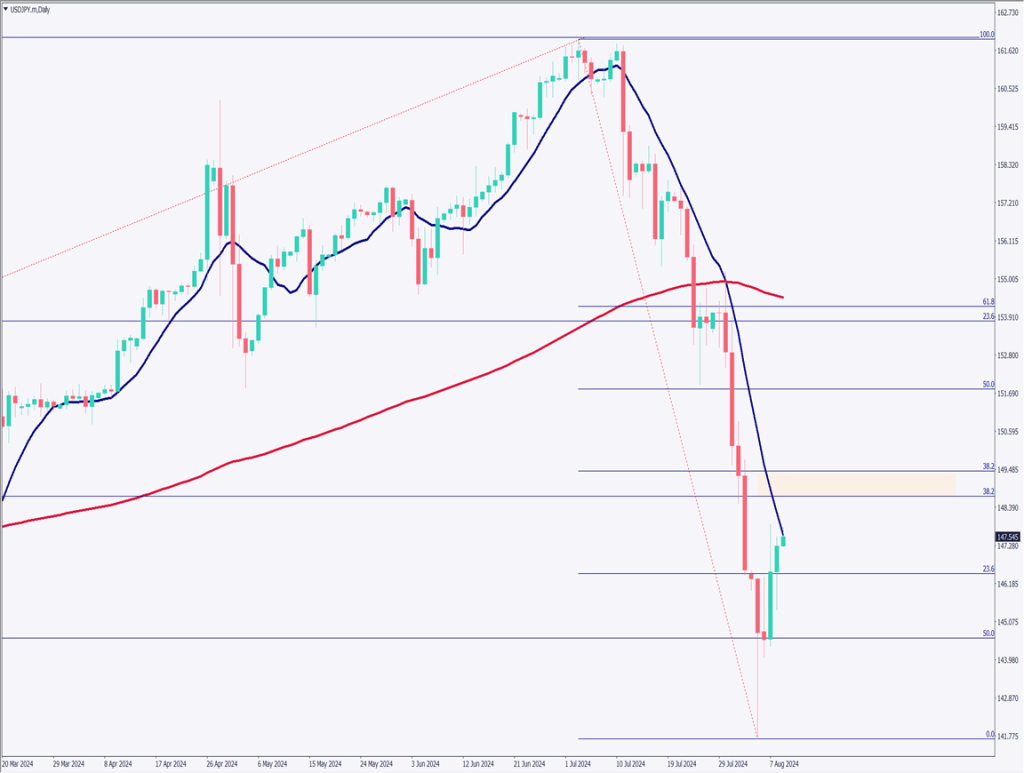
Analyzing the USDJPY 1-hour chart, the 10-day moving average and the 200-day moving average are forming a golden cross. However, it is still unclear whether this is a temporary rise or a signal for an uptrend, as the 200-day moving average is not flat but trending downward.

The upper target is expected to be around 148.75 JPY. Although a temporary rise may occur, there is a high possibility of a pullback.

Entry: 148.75 JPY, Exit: Around 147 JPY where the 200-day moving average is located, Stop: 149.50 JPY.

Support/Resistance lines

Here are the support and resistance levels to consider going forward:

147.56 JPY – 10-day moving average

[USDJPY/ H1]

Market Sentiment

USDJPY Short: 47% Long: 53%

Featured Currency Pair of the Week (AUDNZD)

AUDNZD surged. The RBA Governor’s comments on willingness to hike rates led to AUD buying. As the RBNZ leans towards a rate cut, the market reacted straightforwardly to policy rate expectations. The pair is trading above the 10-day moving average, and the chart suggests further upward momentum. Attention should be paid to the fact that it has surpassed the 50% Fibonacci retracement level. The upper target is predicted to be 1.099 USD, corresponding to the 61.8% retracement.

Today’s important economic indicators

Economic indicators and eventsJapan time
German Consumer Price Index15:00
Canadian Employment Statistics21:30

*Trading advice in this article is not provided by Milton Markets, but by Shu Fujiyasu Jr., a certified technical analyst.

Ready to trade?

Open live account

Related Analysis

USD/JPY Forms a Range — What’s Next?

USD/JPY Forms a Range — What’s Next?

TodayRead more →
USD/JPY dips slightly on LDP landslide victory

USD/JPY dips slightly on LDP landslide victory

7 days agoRead more →
No Currency Intervention Conducted; Reports of Additional Tariffs on South Korea

No Currency Intervention Conducted; Reports of Additional Tariffs on South Korea

20 days agoRead more →

This material is for informational purposes only and does not constitute investment advice. Trading leveraged products involves significant risk of loss. Past performance is not indicative of future results.

Share

X

Start trading today

  • Fast execution
  • Competitive spreads
  • 24/7 support
Open live accountView account types
Milton Markets
Twitter/XYouTube

Markets

FOREX
CRYPTO
COMMODITIES
INDICES
STOCKS

Trading

  • Flex Account
  • Smart Account
  • Elite Account
  • MetaTrader 5 (MT5)
  • MetaTrader 4 (MT4)
  • Launch WebTrader
  • Learn Hub
  • Economic Calendar
  • Promotions

Company

  • About Us
  • NDD Technology
  • Customer Protection
  • Execution Conditions
  • Company News
  • Blog
  • Market Analysis

Partners

  • IB Program
  • PAMM Program
  • White Label
  • Investor Login
  • Manager Login

Support

  • Terms of Service
  • Privacy Policy
  • Risk Disclosure
  • Contact Us
  • Help Center
  • My Page Login
Milton Markets is a trading name of Milton Markets Ltd. Milton Markets Ltd. is part of Milton Global and is registered in Saint Lucia (Registration Number: 2023-00166). As part of Milton Global, we adhere to the same high regulatory standards as Milton Global Ltd, which is regulated by the Seychelles Financial Services Authority (FSA) under license SD040.
Risk Warning: CFD trading carries high risk and may not suit all investors. You may lose more than your initial investment. Ensure you understand the risks before trading.
Restrictions: Milton Markets does not provide services to the following countries (not limited to these): United States, Canada, European Union countries, Iran, North Korea, Saint Vincent and the Grenadines, Afghanistan, American Samoa, Belarus, Russia, Burundi, Central African Republic, Congo (Brazzaville), Cuba, Iraq, Lebanon, Liberia, Libya, Myanmar, Puerto Rico, Rwanda, Somalia, Sudan, Syria, US Virgin Islands, Venezuela, Yemen, Zimbabwe, Côte d'Ivoire, Mali, Guinea, Eritrea.
You must be 18 years old or the legal age in your country of residence.
By opening an account, you are considered to have registered of your own volition without solicitation from Milton Markets.
Disclaimer: This website does not constitute investment advice. Content should not be construed as personal advice. Seek independent financial advice.
© 2026 Milton Markets. All rights reserved.
TermsPrivacyCookiesRisk