Milton Markets
Markets
Trading
Company
Partners
Sign InOpen Account
  1. Home/
  2. Market Analysis/
  3. USDJPY Temporarily Hits 149 JPY Range, U.S. Economic Data Shows Positive Results【August 16, 2024】
Koki Ando•Aug 16, 2024

USDJPY Temporarily Hits 149 JPY Range, U.S. Economic Data Shows Positive Results【August 16, 2024】

Koki Ando headshot

Daily Market Analysis

Koki AndoChief Market Analyst

Expert analysis of today's market movements and trading opportunities

Koki Ando headshot

Daily Market Analysis

Koki AndoChief Market Analyst

Expert analysis of today's market movements and trading opportunities

Fundamental Analysis

  • U.S. retail sales far exceeded expectations.
  • U.S. jobless claims decreased, U.S. stock indices continued their rally with significant gains.
  • USDJPY surged as the dollar strengthened.

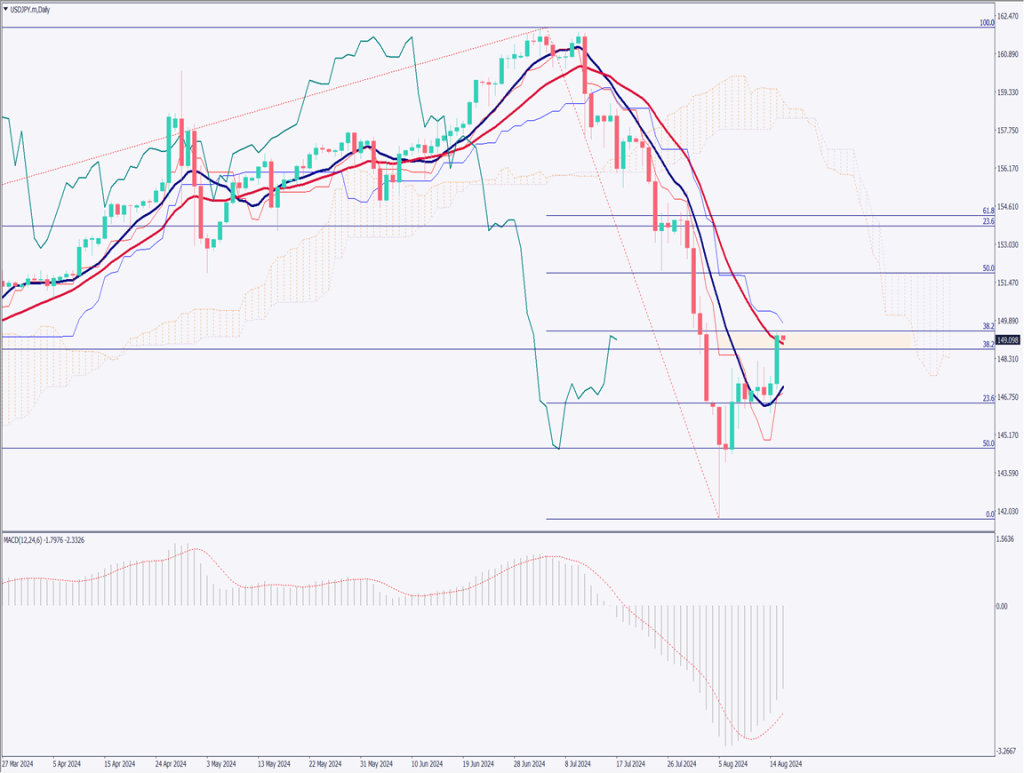
USDJPY technical analysis

Analyzing the daily chart for USDJPY. USDJPY broke above the 28-day moving average and is approaching the 38.2% Fibonacci retracement level. The 10-day moving average is also providing support, which is noteworthy.

U.S. retail sales exceeded market expectations, and jobless claims decreased, suggesting a resilient U.S. economy. Optimism is spreading across the market, with stock indices seeing significant gains and a strengthening USD in response.

Technically, the base line of the Ichimoku Kinko Hyo indicator is looming above as resistance, with 149.78 JPY likely to act as a resistance level. Additionally, the area around 149.43 JPY corresponds to the Fibonacci retracement, so breaking through this level may take some time.

[USDJPY/ D1]

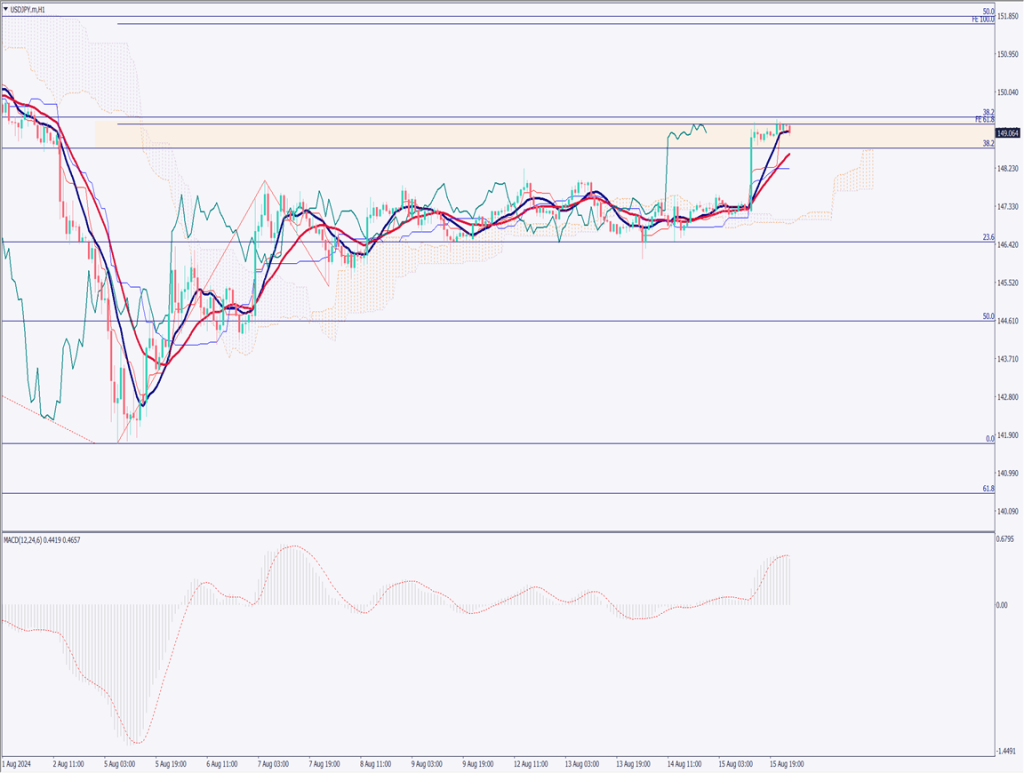
Day trading strategy (1 hour)

Analyzing the 1-hour chart for USDJPY, it shows a pattern of an upward trend, consolidation, and then another upward trend, which allows for a target price using N-calculation values. Applying the N-calculation values, 100% corresponds to 151.65 JPY.

Whether USDJPY can break above the 28-day moving average on the daily chart is a key focus. In the short term, a recovery to the 150 JPY range is possible. However, if the price reaches the 151 JPY range, selling pressure may increase.

Today’s day trading strategy is to sell on rebounds. Sell at 150.80 JPY, which has been a key level in the past, and set the take profit at 149.50 JPY. Set a stop loss if it breaks above 151.25 JPY.

Support/Resistance lines

The following are the support and resistance levels to consider moving forward:

  • 151.65 JPY … N-calculation value
  • 149.78 JPY … Daily Ichimoku base line
[USDJPY/ H1]

Market Sentiment

USDJPY: Sell: 55% / Buy: 45%

Today’s important economic indicators

Economic indicators and eventsJapan time
UK Retail Sales15:00
U.S. Housing Starts21:30
University of Michigan Consumer Sentiment Index23:00

*Trading advice in this article is not provided by Milton Markets, but by Shu Fujiyasu Jr., a certified technical analyst.

Ready to trade?

Open live account

Related Analysis

Gold and Silver Continue to Hit Record Highs

Gold and Silver Continue to Hit Record Highs

19 days agoRead more →
USD/JPY: Selling Pressure Dominates on Rallies

USD/JPY: Selling Pressure Dominates on Rallies

6 days agoRead more →
USD/JPY Forms a Range — What’s Next?

USD/JPY Forms a Range — What’s Next?

TodayRead more →

This material is for informational purposes only and does not constitute investment advice. Trading leveraged products involves significant risk of loss. Past performance is not indicative of future results.

Share

X

Start trading today

  • Fast execution
  • Competitive spreads
  • 24/7 support
Open live accountView account types
Milton Markets
Twitter/XYouTube

Markets

FOREX
CRYPTO
COMMODITIES
INDICES
STOCKS

Trading

  • Flex Account
  • Smart Account
  • Elite Account
  • MetaTrader 5 (MT5)
  • MetaTrader 4 (MT4)
  • Launch WebTrader
  • Learn Hub
  • Economic Calendar
  • Promotions

Company

  • About Us
  • NDD Technology
  • Customer Protection
  • Execution Conditions
  • Company News
  • Blog
  • Market Analysis

Partners

  • IB Program
  • PAMM Program
  • White Label
  • Investor Login
  • Manager Login

Support

  • Terms of Service
  • Privacy Policy
  • Risk Disclosure
  • Contact Us
  • Help Center
  • My Page Login
Milton Markets is a trading name of Milton Markets Ltd. Milton Markets Ltd. is part of Milton Global and is registered in Saint Lucia (Registration Number: 2023-00166). As part of Milton Global, we adhere to the same high regulatory standards as Milton Global Ltd, which is regulated by the Seychelles Financial Services Authority (FSA) under license SD040.
Risk Warning: CFD trading carries high risk and may not suit all investors. You may lose more than your initial investment. Ensure you understand the risks before trading.
Restrictions: Milton Markets does not provide services to the following countries (not limited to these): United States, Canada, European Union countries, Iran, North Korea, Saint Vincent and the Grenadines, Afghanistan, American Samoa, Belarus, Russia, Burundi, Central African Republic, Congo (Brazzaville), Cuba, Iraq, Lebanon, Liberia, Libya, Myanmar, Puerto Rico, Rwanda, Somalia, Sudan, Syria, US Virgin Islands, Venezuela, Yemen, Zimbabwe, Côte d'Ivoire, Mali, Guinea, Eritrea.
You must be 18 years old or the legal age in your country of residence.
By opening an account, you are considered to have registered of your own volition without solicitation from Milton Markets.
Disclaimer: This website does not constitute investment advice. Content should not be construed as personal advice. Seek independent financial advice.
© 2026 Milton Markets. All rights reserved.
TermsPrivacyCookiesRisk