Milton Markets
Markets
Trading
Company
Partners
Sign InOpen Account
  1. Home/
  2. Market Analysis/
  3. USDJPY Declines Temporarily to 144JPY Level, Dollar Index Falls for Fourth Consecutive Day【August 22, 2024】
Koki Ando•Aug 22, 2024

USDJPY Declines Temporarily to 144JPY Level, Dollar Index Falls for Fourth Consecutive Day【August 22, 2024】

Koki Ando headshot

Daily Market Analysis

Koki AndoChief Market Analyst

Expert analysis of today's market movements and trading opportunities

Koki Ando headshot

Daily Market Analysis

Koki AndoChief Market Analyst

Expert analysis of today's market movements and trading opportunities

Fundamental Analysis

  • The minutes of the U.S. FOMC revealed that several members supported a rate cut.
  • The Dollar Index updated its lowest value, falling for the fourth consecutive day.
  • USDJPY temporarily reached the 144JPY level, and U.S. stock indices are approaching record highs.

USDJPY technical analysis

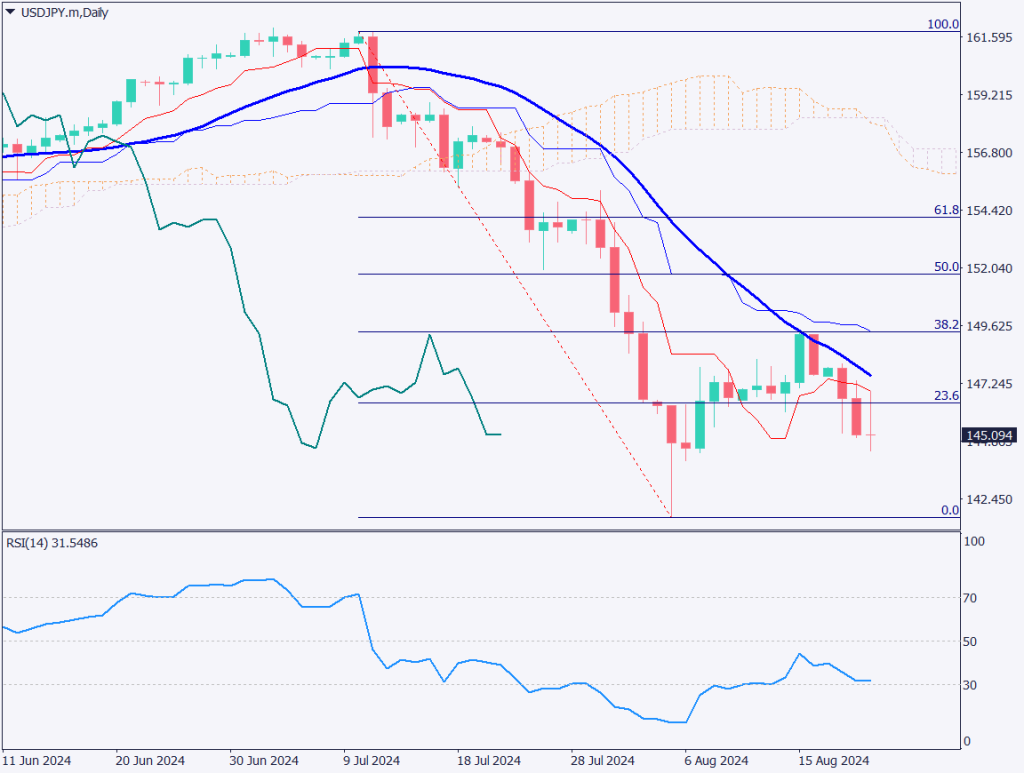
Let’s analyze the daily chart of USDJPY. The 21-day moving average and the conversion line of the Ichimoku Kinko Hyo acted as resistance, forming a doji candlestick. The trigger was the release of the July FOMC minutes, where several members expressed support for a rate cut, making a September rate cut increasingly likely.

USDJPY formed a peak at the 21MA and then reversed. The Dollar Index continues to update its lowest values, leading to a weaker dollar. The focus now shifts to the previous low during the sharp decline at 141.70JPY. When plotting the Fibonacci expansion, the 61.8% level is at 136.90JPY, and the 100% level is at 129.31JPY. RSI is currently at 31, and attention is on whether it will fall below 30.

The future trend depends on when the Bank of Japan acts and how far the U.S. Federal Reserve cuts rates.

[USDJPY/ D1]

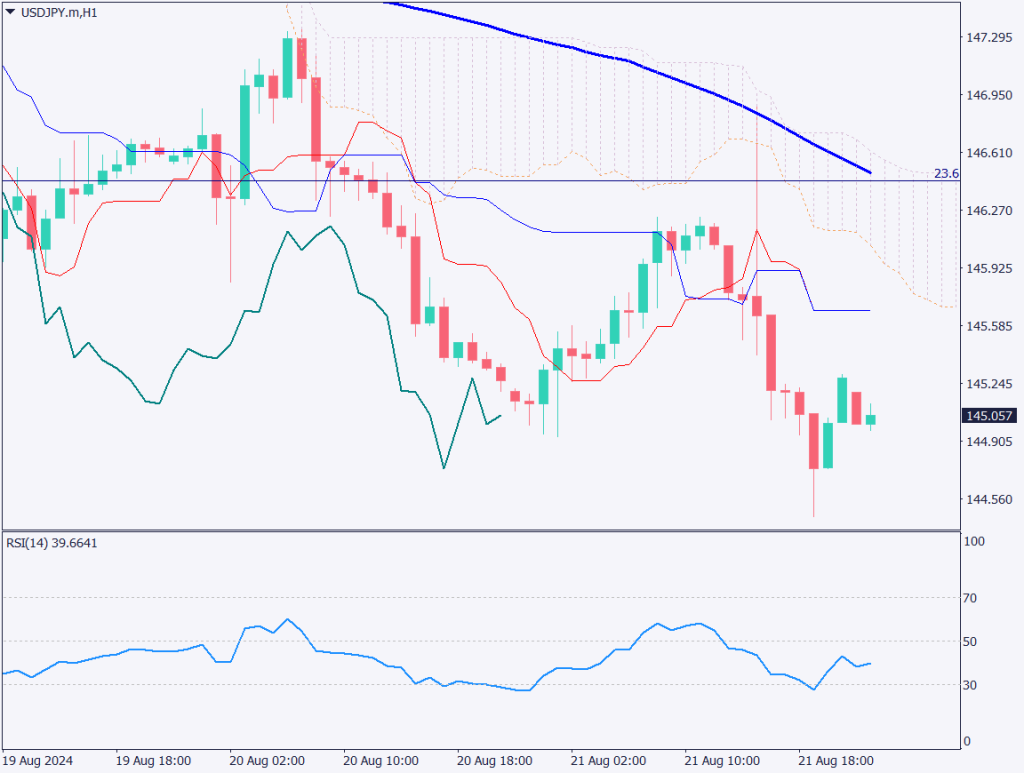
Day trading strategy (1 hour)

Let’s analyze the 1-hour chart of USDJPY. USDJPY seems to be declining, with the 90MA being perceived as a resistance line. The noteworthy point is the appearance of divergence on the RSI. The momentum of the decline is weakening, and it is expected that USDJPY might rebound to the 146JPY level. The direction is generally dollar selling, so USDJPY is expected to continue declining.

The day trading strategy is to sell at the rebound peak. If RSI reaches around 50 and USDJPY climbs to the mid-146JPY level, consider selling actively.

Sell at 146.0JPY and take profit around 141.70JPY. If USDJPY breaks above 146.50JPY, set a stop loss.

Support/Resistance lines

The following support and resistance levels should be considered going forward:

  • 146.70JPY: Previous Low
[USDJPY/ H1]

Market Sentiment

USDJPY Sell: 65% Buy: 35%

Today’s important economic indicators

Economic indicators and eventsJapan time
Nikkei Services PMI9:30
EU Manufacturing Purchasing Managers’ Index17:00
UK Composite PMI17:30
Jackson Hole Symposium21:00
U.S. Services Purchasing Managers’ Index22:45
U.S. Existing Home Sales23:00

*Trading advice in this article is not provided by Milton Markets, but by Shu Fujiyasu Jr., a certified technical analyst.

Ready to trade?

Open live account

Related Analysis

USD/JPY dips slightly on LDP landslide victory

USD/JPY dips slightly on LDP landslide victory

7 days agoRead more →
Gold and Silver Continue to Hit Record Highs

Gold and Silver Continue to Hit Record Highs

19 days agoRead more →
USD/JPY: Selling Pressure Dominates on Rallies

USD/JPY: Selling Pressure Dominates on Rallies

6 days agoRead more →

This material is for informational purposes only and does not constitute investment advice. Trading leveraged products involves significant risk of loss. Past performance is not indicative of future results.

Share

X

Start trading today

  • Fast execution
  • Competitive spreads
  • 24/7 support
Open live accountView account types
Milton Markets
Twitter/XYouTube

Markets

FOREX
CRYPTO
COMMODITIES
INDICES
STOCKS

Trading

  • Flex Account
  • Smart Account
  • Elite Account
  • MetaTrader 5 (MT5)
  • MetaTrader 4 (MT4)
  • Launch WebTrader
  • Learn Hub
  • Economic Calendar
  • Promotions

Company

  • About Us
  • NDD Technology
  • Customer Protection
  • Execution Conditions
  • Company News
  • Blog
  • Market Analysis

Partners

  • IB Program
  • PAMM Program
  • White Label
  • Investor Login
  • Manager Login

Support

  • Terms of Service
  • Privacy Policy
  • Risk Disclosure
  • Contact Us
  • Help Center
  • My Page Login
Milton Markets is a trading name of Milton Markets Ltd. Milton Markets Ltd. is part of Milton Global and is registered in Saint Lucia (Registration Number: 2023-00166). As part of Milton Global, we adhere to the same high regulatory standards as Milton Global Ltd, which is regulated by the Seychelles Financial Services Authority (FSA) under license SD040.
Risk Warning: CFD trading carries high risk and may not suit all investors. You may lose more than your initial investment. Ensure you understand the risks before trading.
Restrictions: Milton Markets does not provide services to the following countries (not limited to these): United States, Canada, European Union countries, Iran, North Korea, Saint Vincent and the Grenadines, Afghanistan, American Samoa, Belarus, Russia, Burundi, Central African Republic, Congo (Brazzaville), Cuba, Iraq, Lebanon, Liberia, Libya, Myanmar, Puerto Rico, Rwanda, Somalia, Sudan, Syria, US Virgin Islands, Venezuela, Yemen, Zimbabwe, Côte d'Ivoire, Mali, Guinea, Eritrea.
You must be 18 years old or the legal age in your country of residence.
By opening an account, you are considered to have registered of your own volition without solicitation from Milton Markets.
Disclaimer: This website does not constitute investment advice. Content should not be construed as personal advice. Seek independent financial advice.
© 2026 Milton Markets. All rights reserved.
TermsPrivacyCookiesRisk