Milton Markets
Markets
Trading
Company
Partners
Sign InOpen Account
  1. Home/
  2. Market Analysis/
  3. USDJPY Slightly Rises, Supported by Upward Revision of U.S. Economic Indicators【August 30, 2024】
Koki Ando•Aug 30, 2024

USDJPY Slightly Rises, Supported by Upward Revision of U.S. Economic Indicators【August 30, 2024】

Koki Ando headshot

Daily Market Analysis

Koki AndoChief Market Analyst

Expert analysis of today's market movements and trading opportunities

Koki Ando headshot

Daily Market Analysis

Koki AndoChief Market Analyst

Expert analysis of today's market movements and trading opportunities

Fundamental Analysis

  • U.S. GDP Revised Upward, Personal Consumption Remains Strong
  • Focus on Changes in U.S. Fed’s Rate Cut Outlook, U.S. Price-Related Indicators to Be Released Today

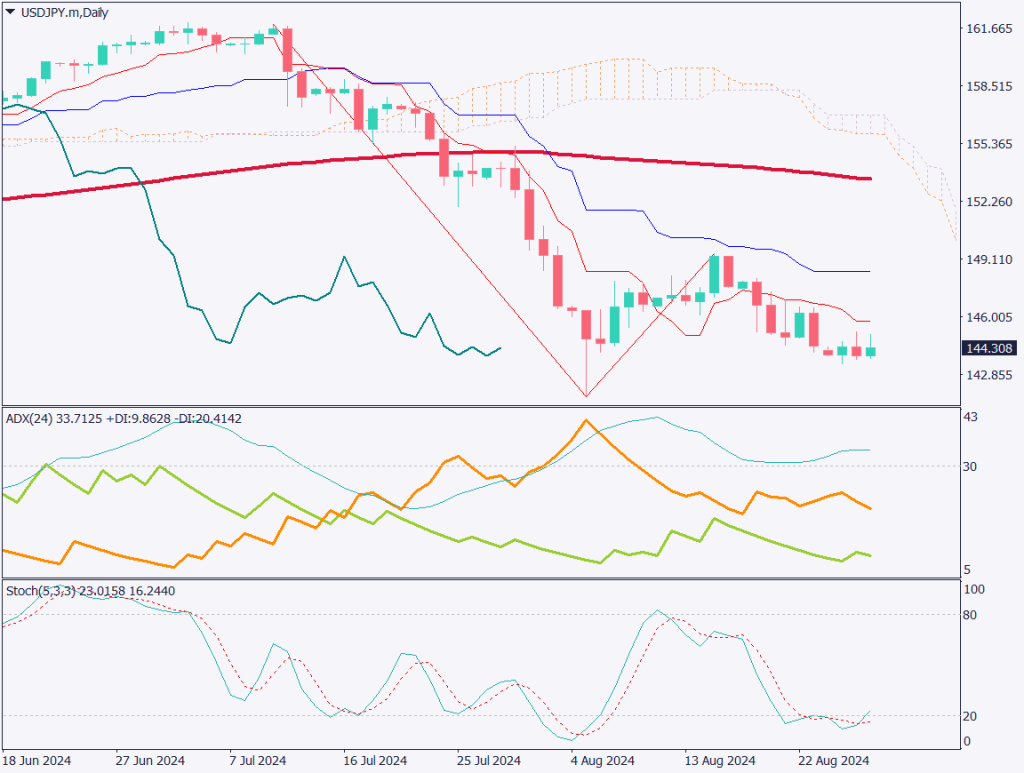
USDJPY technical analysis

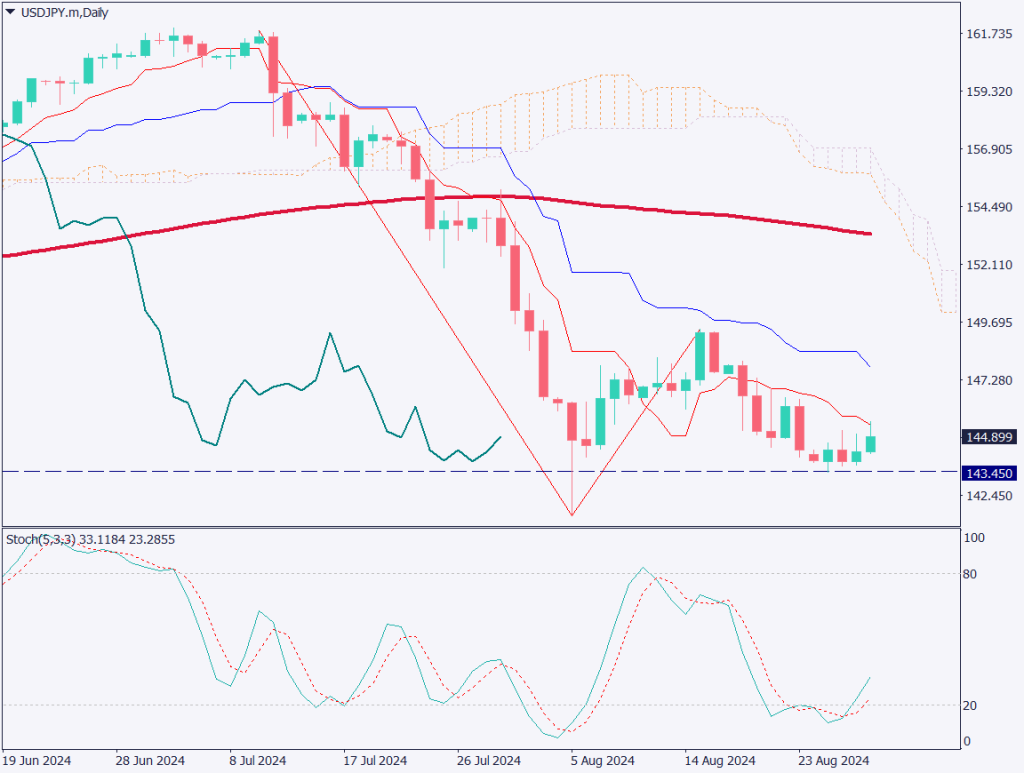
Analyzing the daily chart of USDJPY. The USDJPY is facing resistance at the conversion line. The U.S. GDP was revised upward to 3.0%, and U.S. personal consumption was also revised up to 2.9% from the preliminary figures. Additionally, NVIDIA’s earnings exceeded market expectations. Although NVIDIA’s stock price is currently declining, it is expected that buying will come in on dips.

However, the USDJPY is facing heavy resistance. Despite strong U.S. economic indicators, leading to increased buying of the USD, the USDJPY failed to maintain levels above 145JPY. The inability to surpass the conversion line is noteworthy. The key to confirming an uptrend will be whether USDJPY can break above the conversion line. If USDJPY breaks below 143.45JPY, it is likely that yen buying will strengthen, potentially aiming for the 140JPY level.

The Stochastic indicator has exited oversold territory, indicating a potential temporary rise as USDJPY forms a rebound high.

[USDJPY/ D1]

Day trading strategy (1 hour)

Analyzing the 1-hour chart of USDJPY. The 200-period moving average is acting as support for USDJPY. Additionally, the baseline of the Ichimoku Cloud is also functioning as a support line. A rising trendline can be drawn, with the 144.75JPY level serving as a key price range.

Today’s day trading strategy is challenging, but considering the strong performance of the U.S. stock market yesterday and the 1-hour chart’s movement, I prefer short-term buying on dips. However, I will remain cautious during the NY session when U.S. economic indicators are released, and will determine the direction after seeing the results.

Support/Resistance lines

The following support and resistance levels should be considered moving forward:

  • 145.50JPY – Recent High on the 1-Hour Chart
  • 145.17JPY – Conversion Line on the Daily Chart
  • 143.45JPY – Recent Low on the Daily Chart
[USDJPY/ H1]

Market Sentiment

USDJPY Sell: 33% Buy: 67%

Today’s important economic indicators

Economic indicators and eventsJapan time
Japan Industrial Production8:50
EU Consumer Price Index18:00
U.S. Core PCE Price Index21:30
Canada GDP21:30
U.S. Michigan Consumer Sentiment Index23:00

*Trading advice in this article is not provided by Milton Markets, but by Shu Fujiyasu Jr., a certified technical analyst.

Ready to trade?

Open live account

Related Analysis

USD/JPY dips slightly on LDP landslide victory

USD/JPY dips slightly on LDP landslide victory

7 days agoRead more →
Gold and Silver Continue to Hit Record Highs

Gold and Silver Continue to Hit Record Highs

19 days agoRead more →
No Currency Intervention Conducted; Reports of Additional Tariffs on South Korea

No Currency Intervention Conducted; Reports of Additional Tariffs on South Korea

20 days agoRead more →

This material is for informational purposes only and does not constitute investment advice. Trading leveraged products involves significant risk of loss. Past performance is not indicative of future results.

Share

X

Start trading today

  • Fast execution
  • Competitive spreads
  • 24/7 support
Open live accountView account types
Milton Markets
Twitter/XYouTube

Markets

FOREX
CRYPTO
COMMODITIES
INDICES
STOCKS

Trading

  • Flex Account
  • Smart Account
  • Elite Account
  • MetaTrader 5 (MT5)
  • MetaTrader 4 (MT4)
  • Launch WebTrader
  • Learn Hub
  • Economic Calendar
  • Promotions

Company

  • About Us
  • NDD Technology
  • Customer Protection
  • Execution Conditions
  • Company News
  • Blog
  • Market Analysis

Partners

  • IB Program
  • PAMM Program
  • White Label
  • Investor Login
  • Manager Login

Support

  • Terms of Service
  • Privacy Policy
  • Risk Disclosure
  • Contact Us
  • Help Center
  • My Page Login
Milton Markets is a trading name of Milton Markets Ltd. Milton Markets Ltd. is part of Milton Global and is registered in Saint Lucia (Registration Number: 2023-00166). As part of Milton Global, we adhere to the same high regulatory standards as Milton Global Ltd, which is regulated by the Seychelles Financial Services Authority (FSA) under license SD040.
Risk Warning: CFD trading carries high risk and may not suit all investors. You may lose more than your initial investment. Ensure you understand the risks before trading.
Restrictions: Milton Markets does not provide services to the following countries (not limited to these): United States, Canada, European Union countries, Iran, North Korea, Saint Vincent and the Grenadines, Afghanistan, American Samoa, Belarus, Russia, Burundi, Central African Republic, Congo (Brazzaville), Cuba, Iraq, Lebanon, Liberia, Libya, Myanmar, Puerto Rico, Rwanda, Somalia, Sudan, Syria, US Virgin Islands, Venezuela, Yemen, Zimbabwe, Côte d'Ivoire, Mali, Guinea, Eritrea.
You must be 18 years old or the legal age in your country of residence.
By opening an account, you are considered to have registered of your own volition without solicitation from Milton Markets.
Disclaimer: This website does not constitute investment advice. Content should not be construed as personal advice. Seek independent financial advice.
© 2026 Milton Markets. All rights reserved.
TermsPrivacyCookiesRisk