Milton Markets
Markets
Trading
Company
Partners
Sign InOpen Account
  1. Home/
  2. Market Analysis/
  3. USDJPY Rises to 146 JPY Level, End-of-Month Rebalancing Might Drive the Increase【September 2, 2024】
Koki Ando•Sep 2, 2024

USDJPY Rises to 146 JPY Level, End-of-Month Rebalancing Might Drive the Increase【September 2, 2024】

Koki Ando headshot

Daily Market Analysis

Koki AndoChief Market Analyst

Expert analysis of today's market movements and trading opportunities

Koki Ando headshot

Daily Market Analysis

Koki AndoChief Market Analyst

Expert analysis of today's market movements and trading opportunities

Fundamental Analysis

  • The U.S. stock market closed the month with a bullish candlestick, shifting market focus to U.S. employment conditions.
  • The Dollar Index has continued to rise for three consecutive days, though a temporary correction may occur before the employment data is released.
  • Gold has been on a winning streak, marking six consecutive months of gains on the monthly chart.

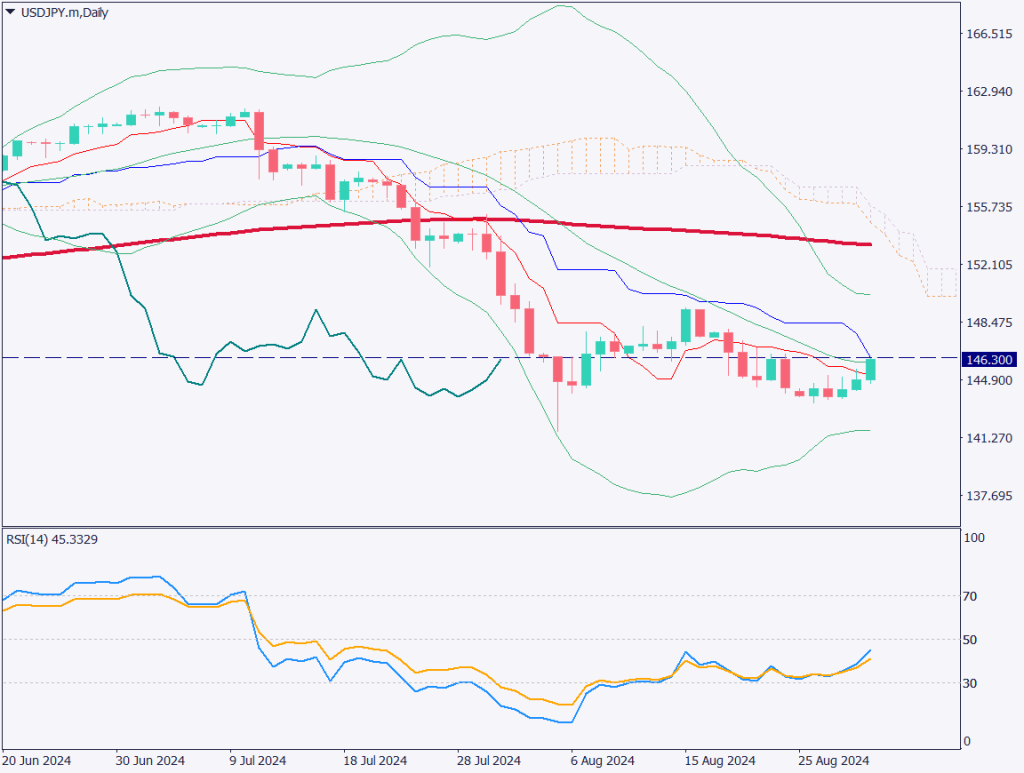
USDJPY technical analysis

Analyzing the daily chart of USDJPY, the pair has broken above the conversion line and is attempting to surpass the base line. Volatility is gradually stabilizing, and expectations for a significant 0.50% rate cut have diminished. Instead, the forecast has shifted to a more moderate 0.25% rate cut, leading to a stronger USD and a weaker JPY. With the U.S. stock market closed today, significant movements are not expected.

The RSI indicates that the pair is hovering around the 46 level, suggesting that the upward trend may take a breather. If the pair continues to rise, the 148 JPY level might be the next target. This week, key indicators such as U.S. employment data, ISM, and ADP reports are scheduled for release. Volatility is expected to increase towards the end of the week, so it may be wise to wait for further developments.

[USDJPY/ D1]

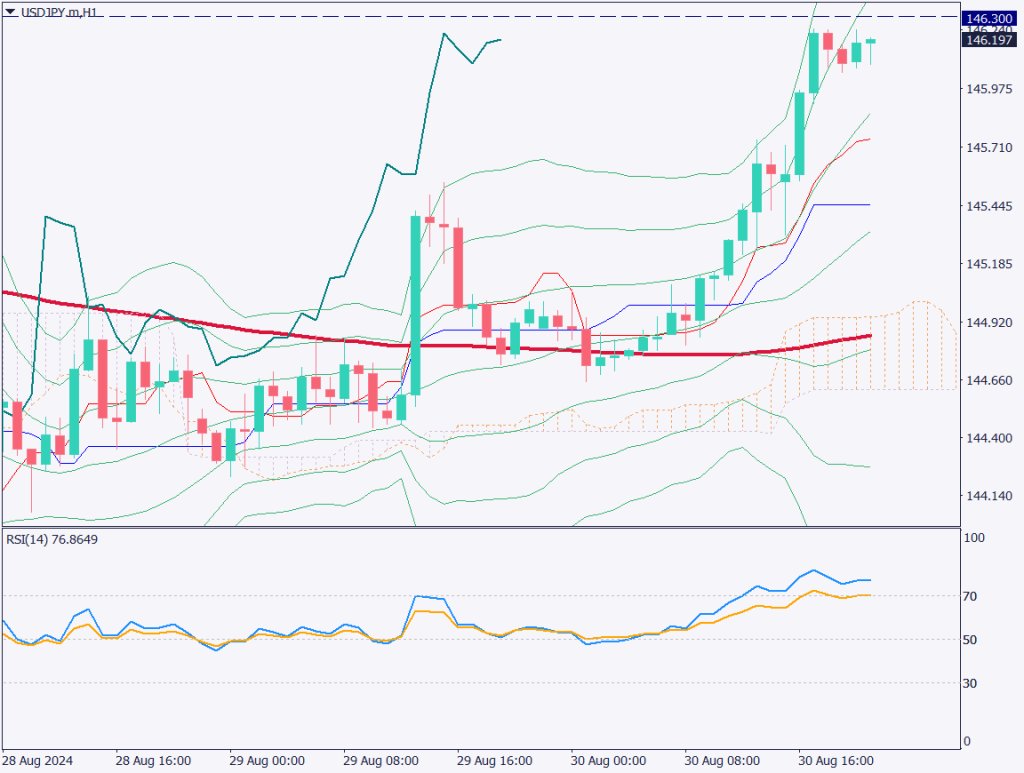
Day trading strategy (1 hour)

Analyzing the 1-hour chart of USDJPY, resistance is seen around the 146.30 JPY level. The 14-period RSI is at 76, indicating overbought conditions, suggesting a potential pullback. The primary strategy for day trading is to buy on dips. Consider entering a buy position around the 145.750 JPY level, near the base line, and aim for a target of 146.45 JPY. Set a stop at 145.40 JPY.

Support/Resistance lines

The following are the support and resistance levels to consider moving forward:

  • 146.30 JPY: Significant historical support/resistance zone.
[USDJPY/ H1]

Market Sentiment

USDJPY Sell: 51% Buy: 49%

Today’s important economic indicators

Economic indicators and eventsJapan time
U.S. and Canada Public Holiday–
Germany Retail Sales
15:00
EU Manufacturing PMI17:00

*Trading advice in this article is not provided by Milton Markets, but by Shu Fujiyasu Jr., a certified technical analyst.

Ready to trade?

Open live account

Related Analysis

USD/JPY Forms a Range — What’s Next?

USD/JPY Forms a Range — What’s Next?

TodayRead more →
Can Gold Renew Its Record High?

Can Gold Renew Its Record High?

10 days agoRead more →
USD/JPY: Selling Pressure Dominates on Rallies

USD/JPY: Selling Pressure Dominates on Rallies

6 days agoRead more →

This material is for informational purposes only and does not constitute investment advice. Trading leveraged products involves significant risk of loss. Past performance is not indicative of future results.

Share

X

Start trading today

  • Fast execution
  • Competitive spreads
  • 24/7 support
Open live accountView account types
Milton Markets
Twitter/XYouTube

Markets

FOREX
CRYPTO
COMMODITIES
INDICES
STOCKS

Trading

  • Flex Account
  • Smart Account
  • Elite Account
  • MetaTrader 5 (MT5)
  • MetaTrader 4 (MT4)
  • Launch WebTrader
  • Learn Hub
  • Economic Calendar
  • Promotions

Company

  • About Us
  • NDD Technology
  • Customer Protection
  • Execution Conditions
  • Company News
  • Blog
  • Market Analysis

Partners

  • IB Program
  • PAMM Program
  • White Label
  • Investor Login
  • Manager Login

Support

  • Terms of Service
  • Privacy Policy
  • Risk Disclosure
  • Contact Us
  • Help Center
  • My Page Login
Milton Markets is a trading name of Milton Markets Ltd. Milton Markets Ltd. is part of Milton Global and is registered in Saint Lucia (Registration Number: 2023-00166). As part of Milton Global, we adhere to the same high regulatory standards as Milton Global Ltd, which is regulated by the Seychelles Financial Services Authority (FSA) under license SD040.
Risk Warning: CFD trading carries high risk and may not suit all investors. You may lose more than your initial investment. Ensure you understand the risks before trading.
Restrictions: Milton Markets does not provide services to the following countries (not limited to these): United States, Canada, European Union countries, Iran, North Korea, Saint Vincent and the Grenadines, Afghanistan, American Samoa, Belarus, Russia, Burundi, Central African Republic, Congo (Brazzaville), Cuba, Iraq, Lebanon, Liberia, Libya, Myanmar, Puerto Rico, Rwanda, Somalia, Sudan, Syria, US Virgin Islands, Venezuela, Yemen, Zimbabwe, Côte d'Ivoire, Mali, Guinea, Eritrea.
You must be 18 years old or the legal age in your country of residence.
By opening an account, you are considered to have registered of your own volition without solicitation from Milton Markets.
Disclaimer: This website does not constitute investment advice. Content should not be construed as personal advice. Seek independent financial advice.
© 2026 Milton Markets. All rights reserved.
TermsPrivacyCookiesRisk