Milton Markets
Markets
Trading
Company
Partners
Sign InOpen Account
  1. Home/
  2. Market Analysis/
  3. Gold Rebounds and Rises as Focus Shifts to US Employment Data【September 6, 2024】
Koki Ando•Sep 6, 2024

Gold Rebounds and Rises as Focus Shifts to US Employment Data【September 6, 2024】

Koki Ando headshot

Daily Market Analysis

Koki AndoChief Market Analyst

Expert analysis of today's market movements and trading opportunities

Koki Ando headshot

Daily Market Analysis

Koki AndoChief Market Analyst

Expert analysis of today's market movements and trading opportunities

Fundamental Analysis

  • The US ADP employment data fell short of expectations, while the US ISM statistics exceeded forecasts.
  • Expectations for a rate cut are rising, putting upward pressure on gold.
  • Today’s US employment data is under scrutiny, with attention on the unemployment rate.

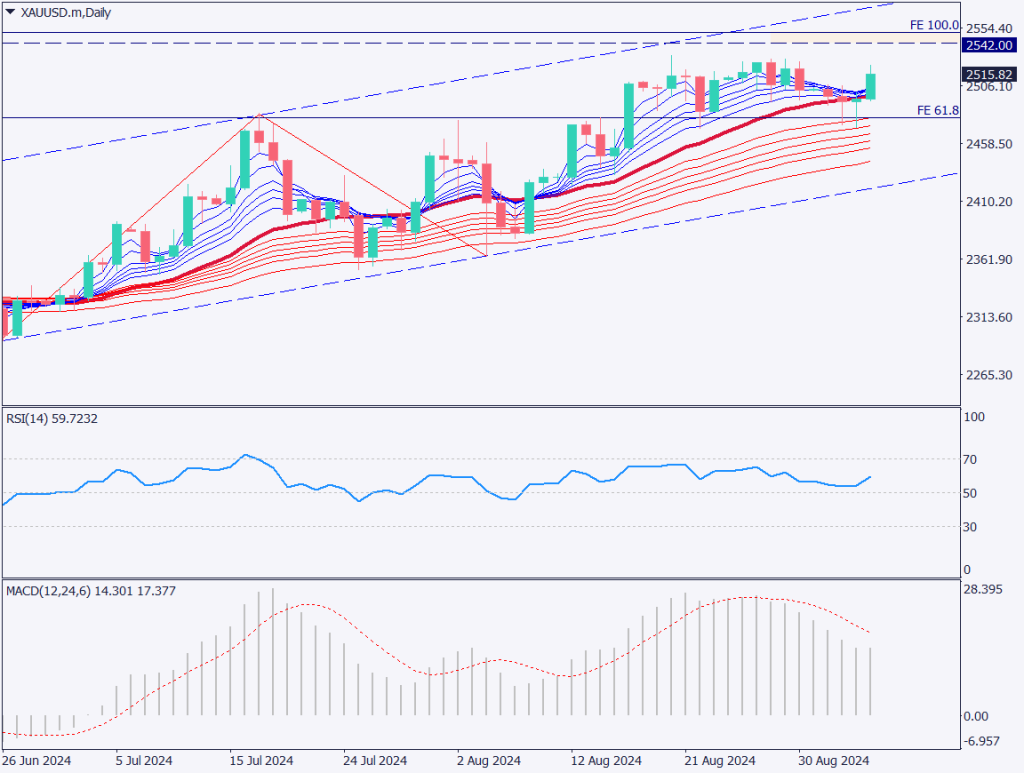
XAUUSD technical analysis

Analyzing the daily chart of gold, it can be seen that gold rebounded from the 61.8% Fibonacci expansion level, with the 28-day moving average being closely watched. The appearance of a hammer candlestick near the 28-day moving average suggests buying interest at the dip. Since the 61.8% level was clearly respected, there is a high probability that the price will rise toward the 100% level.

The 100% level corresponds to 2,550 USD, but the first key point would be breaking the previous high at 2,531 USD. The RSI is at 59, indicating there is room for upward movement. The MACD crossing above the signal line will be the key point. If this happens, new buying interest is likely to emerge, further accelerating the upward trend.

However, given the uncertainty around today’s US employment data, position management is crucial, though the overall outlook remains bullish.

[XAUUSD/ D1]

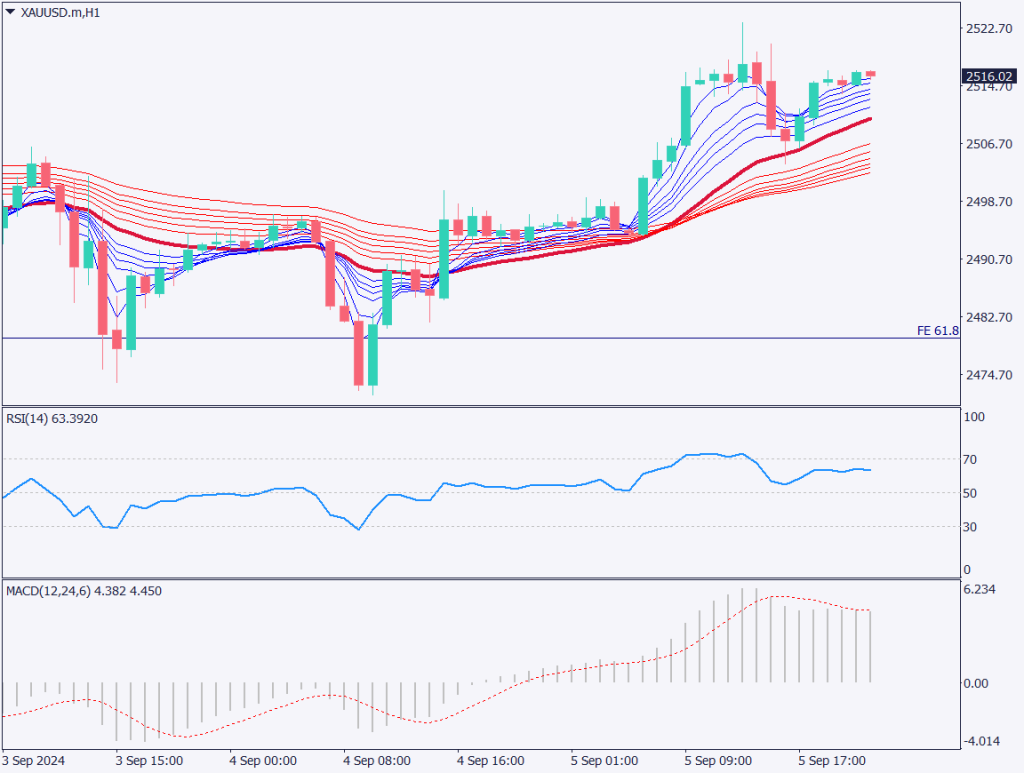
Day trading strategy (1 hour)

Analyzing the 1-hour chart of gold, we see a gradual upward trend, as confirmed by the GMMA. The 28-day moving average is being closely monitored, and the next price target is expected to be the recent high of 2,531 USD. The RSI is at 61, indicating room for further growth.

Price targets for the resistance zones are predicted to be 2,531 USD, 2,542 USD, and 2,550 USD.

The day trading strategy is to buy. Given the likelihood of weak numbers in the US employment data, due to the decline in job openings and the weak ADP report, it’s expected that the US employment data may also show weak results. However, the plan is not to hold any positions before the data release.

Throughout the day, the outlook is bullish, and after the employment data release, the plan is to maintain a buying perspective while monitoring the situation. The final profit target is set at 2,550 USD.

Support/Resistance lines

The following support and resistance lines should be considered moving forward:

2,531 USD – recent high

[XAUUSD/ H1]

Market Sentiment

XAUUSD – Sell: 71%, Buy: 29%

Today’s important economic indicators

Economic indicators and eventsJapan time
Japan Household Spending8:30
EU Gross Domestic Product18:00
US Employment Data21:30
Canada Employment Data21:30
Fed’s Waller SpeechMidnight (0:00)

*Trading advice in this article is not provided by Milton Markets, but by Shu Fujiyasu Jr., a certified technical analyst.

Ready to trade?

Open live account

Related Analysis

Can Gold Renew Its Record High?

Can Gold Renew Its Record High?

10 days agoRead more →
Gold and Silver Continue to Hit Record Highs

Gold and Silver Continue to Hit Record Highs

19 days agoRead more →
USD/JPY: Selling Pressure Dominates on Rallies

USD/JPY: Selling Pressure Dominates on Rallies

6 days agoRead more →

This material is for informational purposes only and does not constitute investment advice. Trading leveraged products involves significant risk of loss. Past performance is not indicative of future results.

Share

X

Start trading today

  • Fast execution
  • Competitive spreads
  • 24/7 support
Open live accountView account types
Milton Markets
Twitter/XYouTube

Markets

FOREX
CRYPTO
COMMODITIES
INDICES
STOCKS

Trading

  • Flex Account
  • Smart Account
  • Elite Account
  • MetaTrader 5 (MT5)
  • MetaTrader 4 (MT4)
  • Launch WebTrader
  • Learn Hub
  • Economic Calendar
  • Promotions

Company

  • About Us
  • NDD Technology
  • Customer Protection
  • Execution Conditions
  • Company News
  • Blog
  • Market Analysis

Partners

  • IB Program
  • PAMM Program
  • White Label
  • Investor Login
  • Manager Login

Support

  • Terms of Service
  • Privacy Policy
  • Risk Disclosure
  • Contact Us
  • Help Center
  • My Page Login
Milton Markets is a trading name of Milton Markets Ltd. Milton Markets Ltd. is part of Milton Global and is registered in Saint Lucia (Registration Number: 2023-00166). As part of Milton Global, we adhere to the same high regulatory standards as Milton Global Ltd, which is regulated by the Seychelles Financial Services Authority (FSA) under license SD040.
Risk Warning: CFD trading carries high risk and may not suit all investors. You may lose more than your initial investment. Ensure you understand the risks before trading.
Restrictions: Milton Markets does not provide services to the following countries (not limited to these): United States, Canada, European Union countries, Iran, North Korea, Saint Vincent and the Grenadines, Afghanistan, American Samoa, Belarus, Russia, Burundi, Central African Republic, Congo (Brazzaville), Cuba, Iraq, Lebanon, Liberia, Libya, Myanmar, Puerto Rico, Rwanda, Somalia, Sudan, Syria, US Virgin Islands, Venezuela, Yemen, Zimbabwe, Côte d'Ivoire, Mali, Guinea, Eritrea.
You must be 18 years old or the legal age in your country of residence.
By opening an account, you are considered to have registered of your own volition without solicitation from Milton Markets.
Disclaimer: This website does not constitute investment advice. Content should not be construed as personal advice. Seek independent financial advice.
© 2026 Milton Markets. All rights reserved.
TermsPrivacyCookiesRisk