Milton Markets
Markets
Trading
Company
Partners
Sign InOpen Account
  1. Home/
  2. Market Analysis/
  3. USDJPY Shows No Clear Direction as US Core Inflation Surprises on the Upside【September 12, 2024】
Koki Ando•Sep 12, 2024

USDJPY Shows No Clear Direction as US Core Inflation Surprises on the Upside【September 12, 2024】

Koki Ando headshot

Daily Market Analysis

Koki AndoChief Market Analyst

Expert analysis of today's market movements and trading opportunities

Koki Ando headshot

Daily Market Analysis

Koki AndoChief Market Analyst

Expert analysis of today's market movements and trading opportunities

Fundamental Analysis

  • US Core Consumer Price Index exceeds expectations, increasing the likelihood of a 0.25% rate cut.
  • Harris leads in the US presidential debate, with no major market impact.
  • BOJ member reiterates commitment to easing reduction, a factor for JPY appreciation.

USDJPY technical analysis

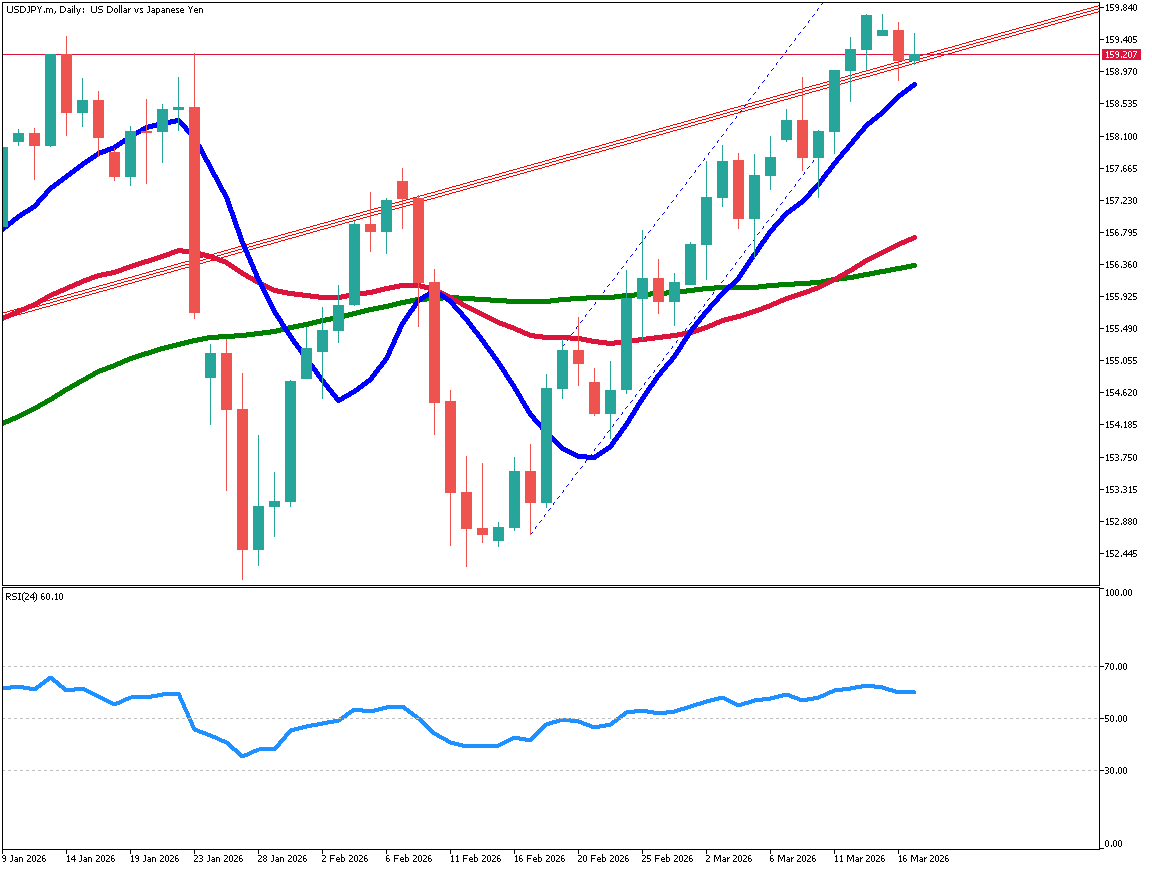
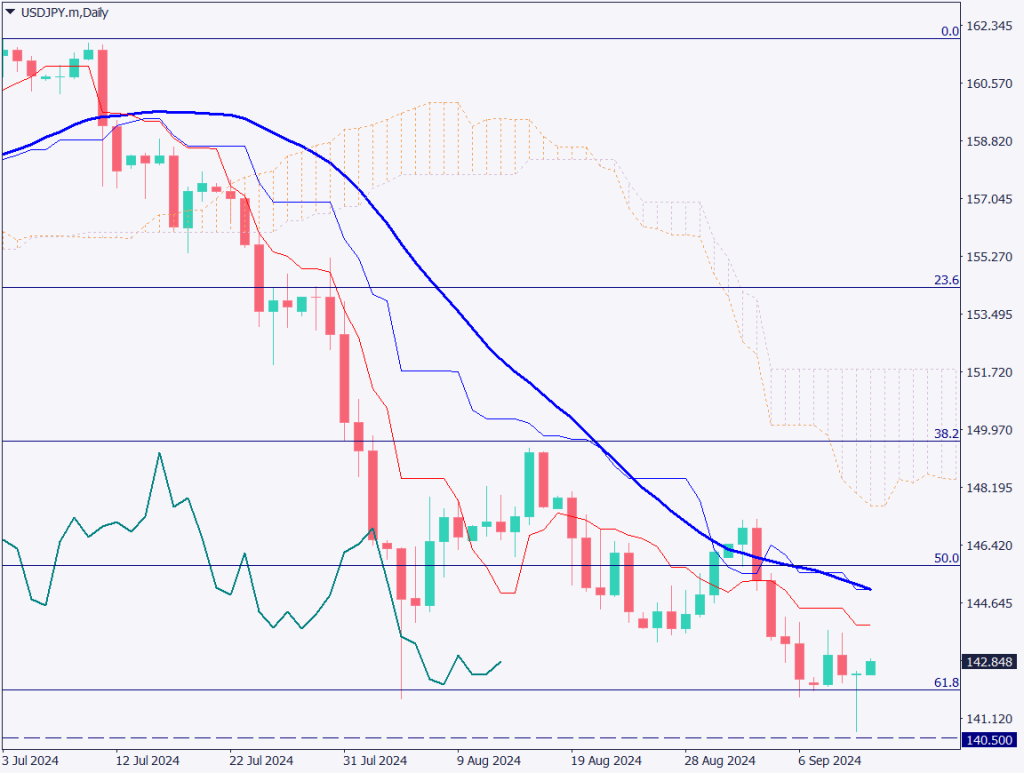
Analyzing the daily chart of USDJPY, the pair fell to 140.70 JPY but rebounded to the upper 142 JPY level following the release of the US core CPI. The RSI shows a rising low, indicating the possibility of a further rise to around 144 JPY.

With the expectation of a major rate cut subsiding, a strong USD buying scenario may develop. However, the long-term trend of JPY appreciation remains, suggesting a sell-on-rally strategy might be effective. The conversion line of the Ichimoku Kinko Hyo serves as a resistance level. Since it’s around 144 JPY, the rally may stall at that level, presenting a selling opportunity on the retracement.

[USDJPY/ D1]

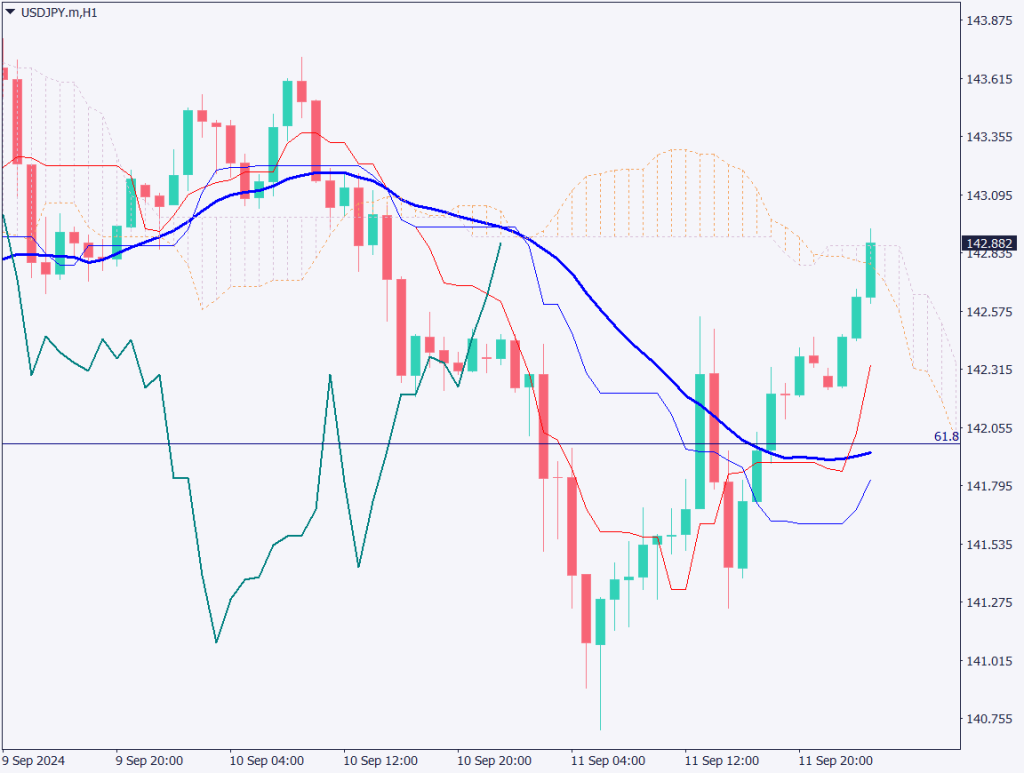
Day trading strategy (1 hour)

Analyzing the 1-hour USDJPY chart, the market is reversing the “Trump trade” due to the higher-than-expected US CPI and Harris’s lead in the debate. Trump is known for his support of the US manufacturing sector, which dislikes a strong USD. Therefore, Harris’s advantage may bring a sense of relief.

The USDJPY plunged to 140.70 JPY, resulting in a significant correction.

However, the fundamental factors—BOJ’s potential rate hike and the Fed’s possible rate cut—remain unchanged, meaning the JPY appreciation trend is likely to resume. The retracement target is around 144 JPY, where the daily conversion line is situated.

The day trading strategy is to sell on rallies. Entry at 144 JPY, take profit at 142.50 JPY, and stop loss at 145.20 JPY.

Support/Resistance lines

Key support and resistance levels to watch:

  • 140.70 JPY – Yesterday’s low
  • 140.25 JPY – 2023 year-end low
[USDJPY/ H1]

Market Sentiment

USDJPY Sell: 41% / Buy: 59%

Today’s important economic indicators

Economic indicators and eventsJapan time
Japan Large Manufacturing Business Conditions Index08:50
Speech by BOJ Member Tamura10:00
US Continuing Jobless Claims21:30
US PPI (Producer Price Index)21:30

*Trading advice in this article is not provided by Milton Markets, but by Shu Fujiyasu Jr., a certified technical analyst.

Ready to trade?

Open live account

Related Analysis

USD/JPY Forms a Range — What’s Next?

USD/JPY Forms a Range — What’s Next?

TodayRead more →
USD/JPY: Selling Pressure Dominates on Rallies

USD/JPY: Selling Pressure Dominates on Rallies

6 days agoRead more →
USD/JPY dips slightly on LDP landslide victory

USD/JPY dips slightly on LDP landslide victory

7 days agoRead more →

This material is for informational purposes only and does not constitute investment advice. Trading leveraged products involves significant risk of loss. Past performance is not indicative of future results.

Share

X

Start trading today

  • Fast execution
  • Competitive spreads
  • 24/7 support
Open live accountView account types
Milton Markets
Twitter/XYouTube

Markets

FOREX
CRYPTO
COMMODITIES
INDICES
STOCKS

Trading

  • Flex Account
  • Smart Account
  • Elite Account
  • MetaTrader 5 (MT5)
  • MetaTrader 4 (MT4)
  • Launch WebTrader
  • Learn Hub
  • Economic Calendar
  • Promotions

Company

  • About Us
  • NDD Technology
  • Customer Protection
  • Execution Conditions
  • Company News
  • Blog
  • Market Analysis

Partners

  • IB Program
  • PAMM Program
  • White Label
  • Investor Login
  • Manager Login

Support

  • Terms of Service
  • Privacy Policy
  • Risk Disclosure
  • Contact Us
  • Help Center
  • My Page Login
Milton Markets is a trading name of Milton Markets Ltd. Milton Markets Ltd. is part of Milton Global and is registered in Saint Lucia (Registration Number: 2023-00166). As part of Milton Global, we adhere to the same high regulatory standards as Milton Global Ltd, which is regulated by the Seychelles Financial Services Authority (FSA) under license SD040.
Risk Warning: CFD trading carries high risk and may not suit all investors. You may lose more than your initial investment. Ensure you understand the risks before trading.
Restrictions: Milton Markets does not provide services to the following countries (not limited to these): United States, Canada, European Union countries, Iran, North Korea, Saint Vincent and the Grenadines, Afghanistan, American Samoa, Belarus, Russia, Burundi, Central African Republic, Congo (Brazzaville), Cuba, Iraq, Lebanon, Liberia, Libya, Myanmar, Puerto Rico, Rwanda, Somalia, Sudan, Syria, US Virgin Islands, Venezuela, Yemen, Zimbabwe, Côte d'Ivoire, Mali, Guinea, Eritrea.
You must be 18 years old or the legal age in your country of residence.
By opening an account, you are considered to have registered of your own volition without solicitation from Milton Markets.
Disclaimer: This website does not constitute investment advice. Content should not be construed as personal advice. Seek independent financial advice.
© 2026 Milton Markets. All rights reserved.
TermsPrivacyCookiesRisk