Milton Markets
Markets
Trading
Company
Partners
Sign InOpen Account
  1. Home/
  2. Market Analysis/
  3. Gold Hits Record High as Stage Is Set for U.S. Rate Cuts【September 13, 2024】
Koki Ando•Sep 13, 2024

Gold Hits Record High as Stage Is Set for U.S. Rate Cuts【September 13, 2024】

Koki Ando headshot

Daily Market Analysis

Koki AndoChief Market Analyst

Expert analysis of today's market movements and trading opportunities

Koki Ando headshot

Daily Market Analysis

Koki AndoChief Market Analyst

Expert analysis of today's market movements and trading opportunities

Fundamental Analysis

  • U.S. unemployment claims have increased, signaling a gradual deterioration in the employment environment.
  • The U.S. Producer Price Index (PPI) slightly exceeded expectations, leading to a slight retreat in expectations for significant rate cuts.
  • Gold hit a record high, reaching 2558 USD.

XAUUSD technical analysis

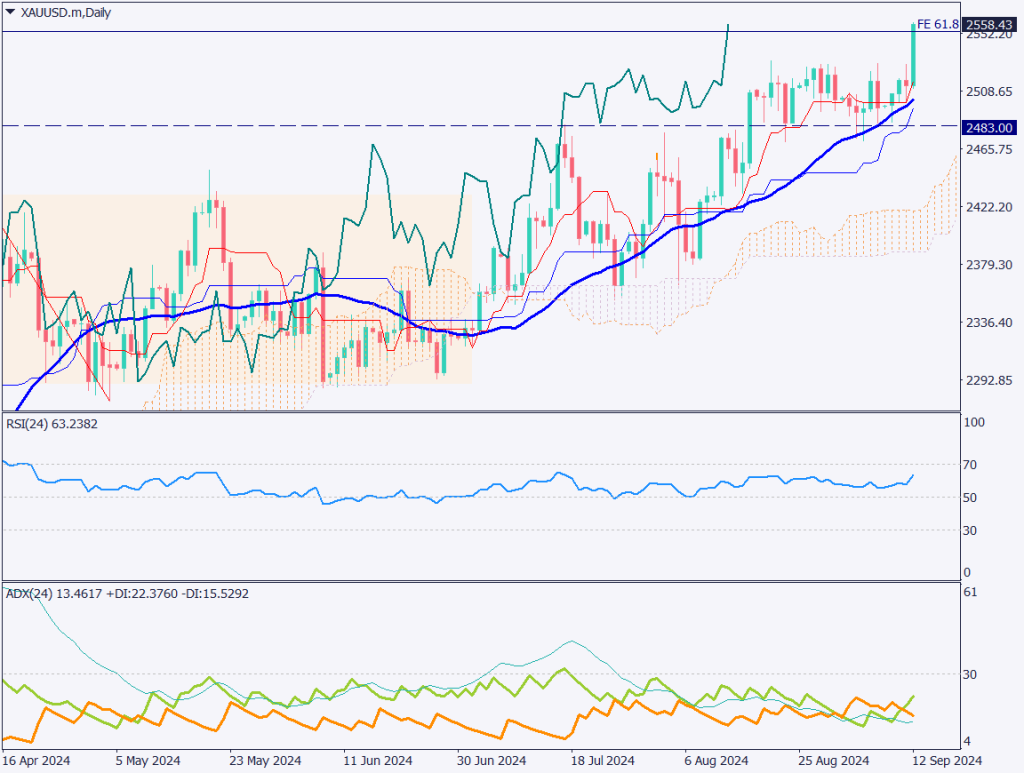
Analyzing the daily chart for gold, the metal broke out of its range-bound market and surged to 2558 USD, hitting an all-time high following U.S. economic data releases yesterday. While the price is nearing the 61.8% Fibonacci expansion level and a correction could be expected, the overall outlook remains bullish.

The 100% Fibonacci level corresponds to 2770 USD, which is still far off. However, with growing expectations of rate cuts, the upward pressure is likely to persist.

U.S. unemployment claims have increased, and inflation rates are also rising. As a result, although the outlook for significant rate cuts has slightly receded, a rate cut is almost certain to prevent further deterioration in the employment situation. The ECB implemented a rate cut yesterday, and the U.S. dollar, as the world’s reserve currency, is soon expected to enter a rate-cut cycle.

[XAUUSD/ D1]

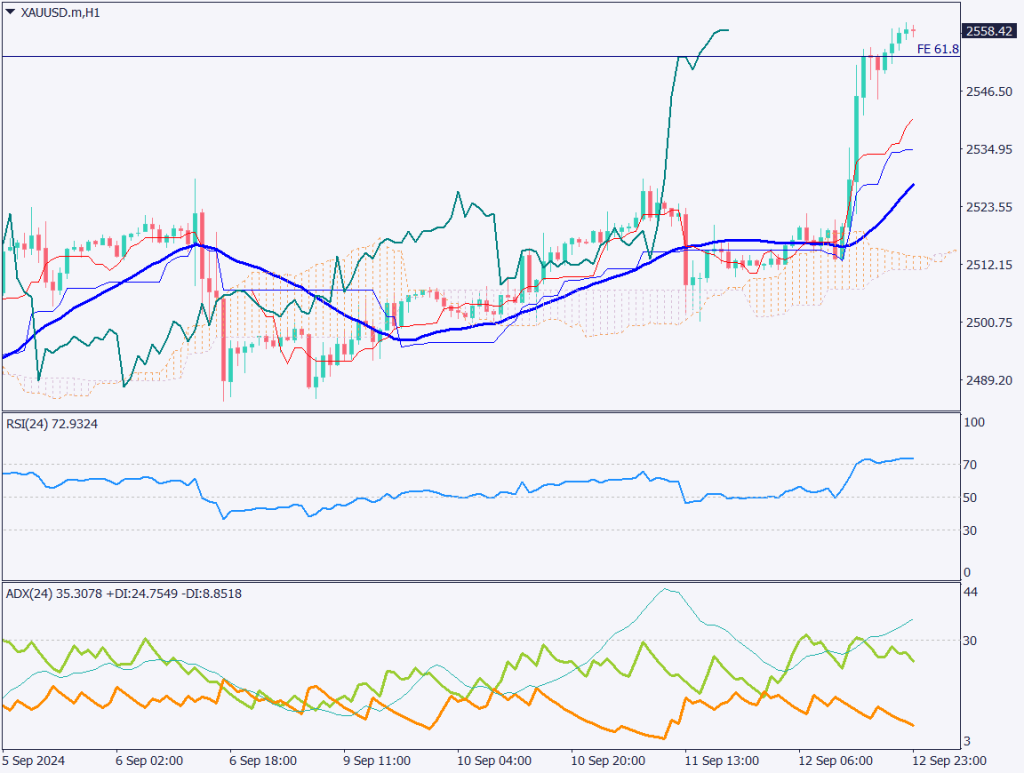
Day trading strategy (1 hour)

Analyzing the 1-hour chart for gold, it shows a sharp rise following the release of U.S. economic data. The +DI has slightly decreased, but the ADX remains above 30, indicating that the uptrend continues. However, in the short term, the RSI has reached 72, suggesting that a correction phase may occur. A decline towards 2530 USD, the previous high in the range-bound market, is possible.

One strategy would be to enter a sell position once the RSI falls below 70, aiming to capitalize on the correction. Another approach is to wait for a pullback and enter a buy position.

For a buy position, aim to enter around 2530 USD. For those targeting the correction, exit around 2545–2550 USD once the RSI dips below 70.

Support/Resistance lines

The following support and resistance levels should be considered:

  • 2530 USD: The previous high in the range-bound market
[XAUUSD/ H1]

Market Sentiment

XAUUSD Sell: 76% Buy: 24%

Today’s important economic indicators

Economic indicators and eventsJapan time
Japan Iron and Steel Production13:30
Michigan University Consumer Sentiment Index23:00

*Trading advice in this article is not provided by Milton Markets, but by Shu Fujiyasu Jr., a certified technical analyst.

Ready to trade?

Open live account

Related Analysis

USD/JPY Forms a Range — What’s Next?

USD/JPY Forms a Range — What’s Next?

TodayRead more →
Can Gold Renew Its Record High?

Can Gold Renew Its Record High?

10 days agoRead more →
No Currency Intervention Conducted; Reports of Additional Tariffs on South Korea

No Currency Intervention Conducted; Reports of Additional Tariffs on South Korea

20 days agoRead more →

This material is for informational purposes only and does not constitute investment advice. Trading leveraged products involves significant risk of loss. Past performance is not indicative of future results.

Share

X

Start trading today

  • Fast execution
  • Competitive spreads
  • 24/7 support
Open live accountView account types
Milton Markets
Twitter/XYouTube

Markets

FOREX
CRYPTO
COMMODITIES
INDICES
STOCKS

Trading

  • Flex Account
  • Smart Account
  • Elite Account
  • MetaTrader 5 (MT5)
  • MetaTrader 4 (MT4)
  • Launch WebTrader
  • Learn Hub
  • Economic Calendar
  • Promotions

Company

  • About Us
  • NDD Technology
  • Customer Protection
  • Execution Conditions
  • Company News
  • Blog
  • Market Analysis

Partners

  • IB Program
  • PAMM Program
  • White Label
  • Investor Login
  • Manager Login

Support

  • Terms of Service
  • Privacy Policy
  • Risk Disclosure
  • Contact Us
  • Help Center
  • My Page Login
Milton Markets is a trading name of Milton Markets Ltd. Milton Markets Ltd. is part of Milton Global and is registered in Saint Lucia (Registration Number: 2023-00166). As part of Milton Global, we adhere to the same high regulatory standards as Milton Global Ltd, which is regulated by the Seychelles Financial Services Authority (FSA) under license SD040.
Risk Warning: CFD trading carries high risk and may not suit all investors. You may lose more than your initial investment. Ensure you understand the risks before trading.
Restrictions: Milton Markets does not provide services to the following countries (not limited to these): United States, Canada, European Union countries, Iran, North Korea, Saint Vincent and the Grenadines, Afghanistan, American Samoa, Belarus, Russia, Burundi, Central African Republic, Congo (Brazzaville), Cuba, Iraq, Lebanon, Liberia, Libya, Myanmar, Puerto Rico, Rwanda, Somalia, Sudan, Syria, US Virgin Islands, Venezuela, Yemen, Zimbabwe, Côte d'Ivoire, Mali, Guinea, Eritrea.
You must be 18 years old or the legal age in your country of residence.
By opening an account, you are considered to have registered of your own volition without solicitation from Milton Markets.
Disclaimer: This website does not constitute investment advice. Content should not be construed as personal advice. Seek independent financial advice.
© 2026 Milton Markets. All rights reserved.
TermsPrivacyCookiesRisk