Milton Markets
Markets
Trading
Company
Partners
Sign InOpen Account
  1. Home/
  2. Market Analysis/
  3. Gold at the $2600 USD Level, Bullish Trend with the Start of U.S. Rate Cut Cycle【September 23, 2024】
Koki Ando•Sep 23, 2024

Gold at the $2600 USD Level, Bullish Trend with the Start of U.S. Rate Cut Cycle【September 23, 2024】

Koki Ando headshot

Daily Market Analysis

Koki AndoChief Market Analyst

Expert analysis of today's market movements and trading opportunities

Koki Ando headshot

Daily Market Analysis

Koki AndoChief Market Analyst

Expert analysis of today's market movements and trading opportunities

Fundamental Analysis

  • The Bank of Japan decided to maintain interest rates, and the market interprets the governor’s stance as cautious regarding rate hikes.
  • With the start of the U.S. rate cut cycle, gold continues its bullish trend.
  • Besides the rate cuts, geopolitical risks and central bank gold purchases may also be contributing factors.

XAUUSD technical analysis

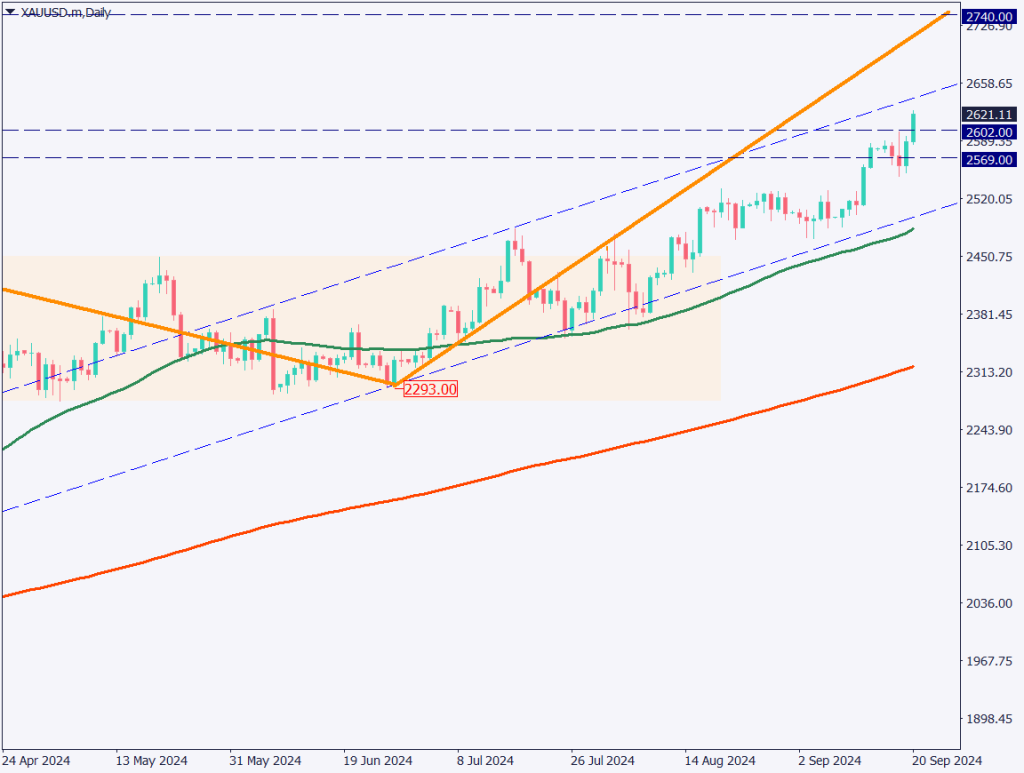
Analyzing the daily gold chart, a significant U.S. rate cut has been decided, and the rate cut cycle has begun. The rate cuts on the U.S. dollar, the world’s reserve currency, have a major impact. Previously, the high interest rate appeal of the U.S. dollar attracted funds, but as the rate cuts proceed, money is more likely to flow into gold.

Gold has risen to the $2600 USD level. It has gained for two consecutive days, closing with a strong bullish candle. The upward pressure is very strong, driven by rate cuts. Additionally, central bank gold acquisitions and the seasonal year-end demand for gold are likely to sustain the upward trend. The instability in the Middle East is also a factor contributing to the rise of gold.

According to the N-measurement method for price range calculation, the target price is $2740 USD. It is supported by the 52-day MA and is aiming for the upper band of the rising channel.

[XAUUSD/ D1]

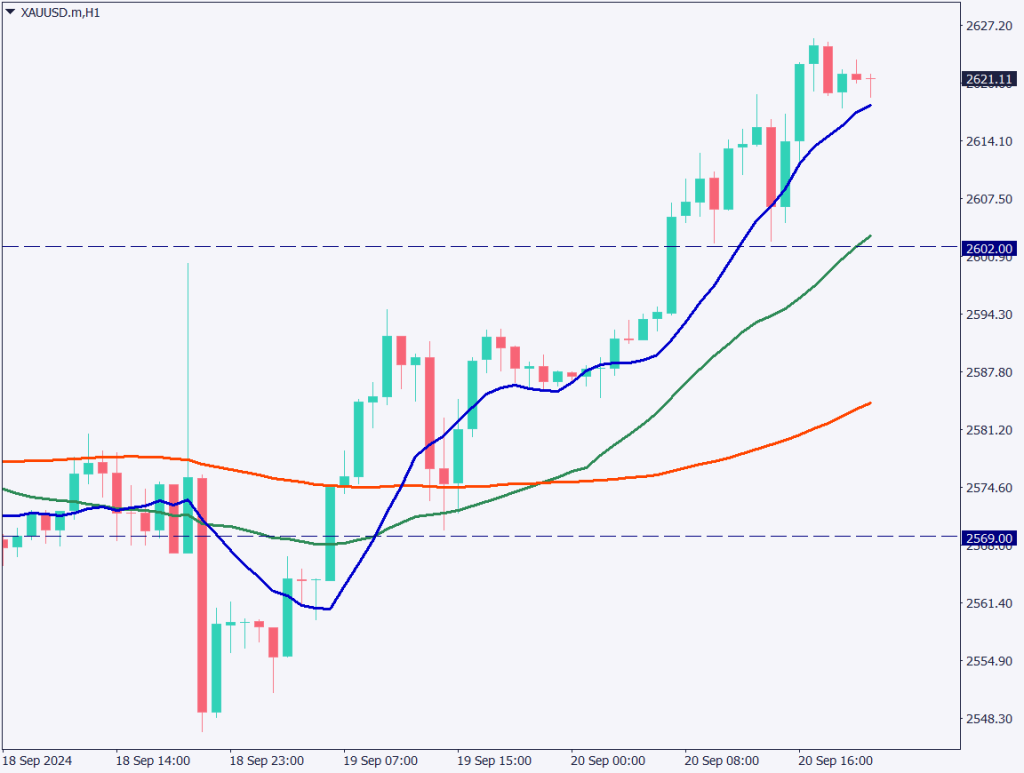
Day trading strategy (1 hour)

Analyzing the 1-hour gold chart, in the past, after reaching a new major level, there has been a tendency for a correction sell-off. This time as well, after rising to the early $2600 USD level, there is a high possibility of a corrective sell-off.

Last week’s close was above the 10-day moving average, but if it falls below the 10MA, there is a good chance it will drop to around $2600 USD. Support levels are at $2590 USD and $2530 USD.

Since the fundamentals suggest a strong buy, I recommend a buy-on-dip strategy. The day trading plan would be to buy at $2585 USD and close at $2615 USD. If it drops below $2580 USD, stop. Wait again for a correction to $2530 USD.

Support/Resistance lines

The following support and resistance lines should be considered moving forward:

  • $2635 USD: Monthly resistance
  • $2561 USD: Daily Fibonacci 61.8%
[XAUUSD/ H1]

Market Sentiment

XAUUSD: Sell: 76% Buy: 24%

Today’s important economic indicators

Economic indicators and eventsJapan time
EU Manufacturing PMI17:00
FOMC Member Speech21:00
U.S. Services PMI22:45
FOMC Member Speech2:00 (next day)

*Trading advice in this article is not provided by Milton Markets, but by Shu Fujiyasu Jr., a certified technical analyst.

Ready to trade?

Open live account

Related Analysis

Gold and Silver Continue to Hit Record Highs

Gold and Silver Continue to Hit Record Highs

19 days agoRead more →
USD/JPY dips slightly on LDP landslide victory

USD/JPY dips slightly on LDP landslide victory

7 days agoRead more →
No Currency Intervention Conducted; Reports of Additional Tariffs on South Korea

No Currency Intervention Conducted; Reports of Additional Tariffs on South Korea

20 days agoRead more →

This material is for informational purposes only and does not constitute investment advice. Trading leveraged products involves significant risk of loss. Past performance is not indicative of future results.

Share

X

Start trading today

  • Fast execution
  • Competitive spreads
  • 24/7 support
Open live accountView account types
Milton Markets
Twitter/XYouTube

Markets

FOREX
CRYPTO
COMMODITIES
INDICES
STOCKS

Trading

  • Flex Account
  • Smart Account
  • Elite Account
  • MetaTrader 5 (MT5)
  • MetaTrader 4 (MT4)
  • Launch WebTrader
  • Learn Hub
  • Economic Calendar
  • Promotions

Company

  • About Us
  • NDD Technology
  • Customer Protection
  • Execution Conditions
  • Company News
  • Blog
  • Market Analysis

Partners

  • IB Program
  • PAMM Program
  • White Label
  • Investor Login
  • Manager Login

Support

  • Terms of Service
  • Privacy Policy
  • Risk Disclosure
  • Contact Us
  • Help Center
  • My Page Login
Milton Markets is a trading name of Milton Markets Ltd. Milton Markets Ltd. is part of Milton Global and is registered in Saint Lucia (Registration Number: 2023-00166). As part of Milton Global, we adhere to the same high regulatory standards as Milton Global Ltd, which is regulated by the Seychelles Financial Services Authority (FSA) under license SD040.
Risk Warning: CFD trading carries high risk and may not suit all investors. You may lose more than your initial investment. Ensure you understand the risks before trading.
Restrictions: Milton Markets does not provide services to the following countries (not limited to these): United States, Canada, European Union countries, Iran, North Korea, Saint Vincent and the Grenadines, Afghanistan, American Samoa, Belarus, Russia, Burundi, Central African Republic, Congo (Brazzaville), Cuba, Iraq, Lebanon, Liberia, Libya, Myanmar, Puerto Rico, Rwanda, Somalia, Sudan, Syria, US Virgin Islands, Venezuela, Yemen, Zimbabwe, Côte d'Ivoire, Mali, Guinea, Eritrea.
You must be 18 years old or the legal age in your country of residence.
By opening an account, you are considered to have registered of your own volition without solicitation from Milton Markets.
Disclaimer: This website does not constitute investment advice. Content should not be construed as personal advice. Seek independent financial advice.
© 2026 Milton Markets. All rights reserved.
TermsPrivacyCookiesRisk