Milton Markets
Markets
Trading
Company
Partners
Sign InOpen Account
  1. Home/
  2. Market Analysis/
  3. EURUSD Falls Below 1.10 USD, Strengthening USD Due to Rising U.S. Interest Rates【October 8, 2024】
Koki Ando•Oct 8, 2024

EURUSD Falls Below 1.10 USD, Strengthening USD Due to Rising U.S. Interest Rates【October 8, 2024】

Koki Ando headshot

Daily Market Analysis

Koki AndoChief Market Analyst

Expert analysis of today's market movements and trading opportunities

Koki Ando headshot

Daily Market Analysis

Koki AndoChief Market Analyst

Expert analysis of today's market movements and trading opportunities

Fundamental Analysis

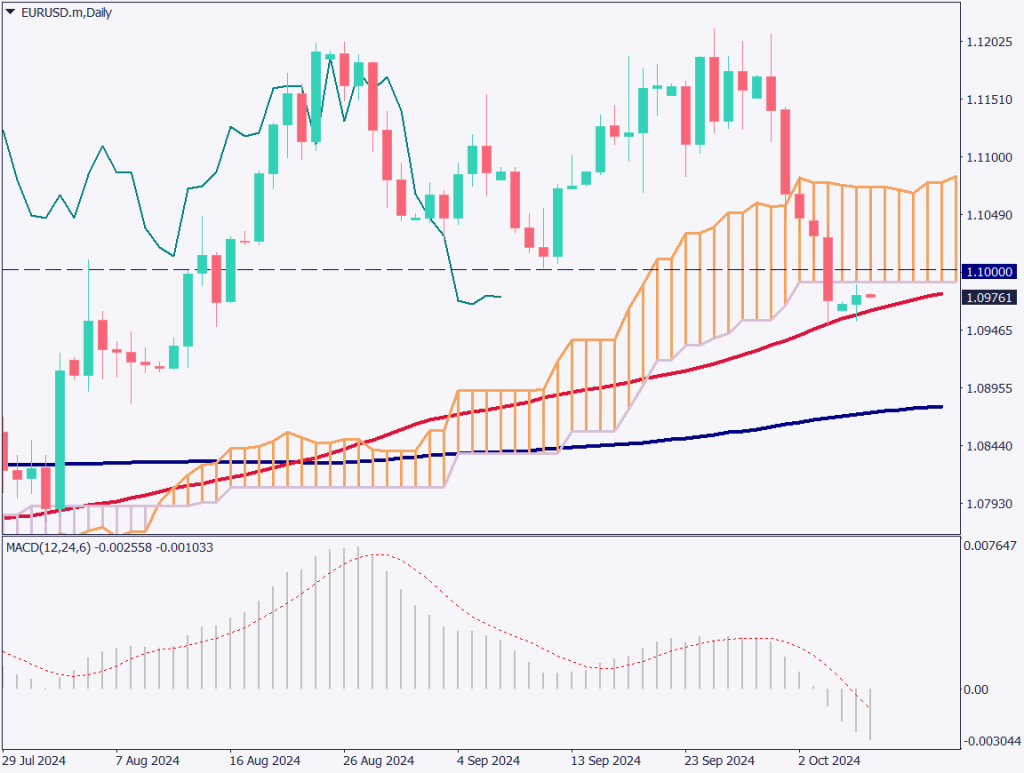
  • EURUSD has formed a double top and broken the neckline.
  • Crude oil prices surge as concerns rise over the escalating conflict between Israel and Iran.
  • The U.S. 10-year bond yield rises to 4%, putting pressure on stock prices.

EURUSD technical analysis

Analyzing the daily chart of EURUSD, the pair has formed a double top and broken the 1.10 USD neckline. After breaking the neckline, a “return move” occurs, where the market tests whether the neckline has turned into a resistance line.

Currently, the 90-day moving average acts as support, with the candles trapped between the resistance line at 1.10 USD and the support of the moving average.

If EURUSD rebounds from the neckline and breaks below the 90-day moving average, stop losses on long positions could be triggered, leading to a significant drop. The U.S. 10-year bond yield has risen above 4.0%, strengthening the USD. This week’s U.S. CPI data and key figure speeches are worth watching.

[EURUSD/ D1]

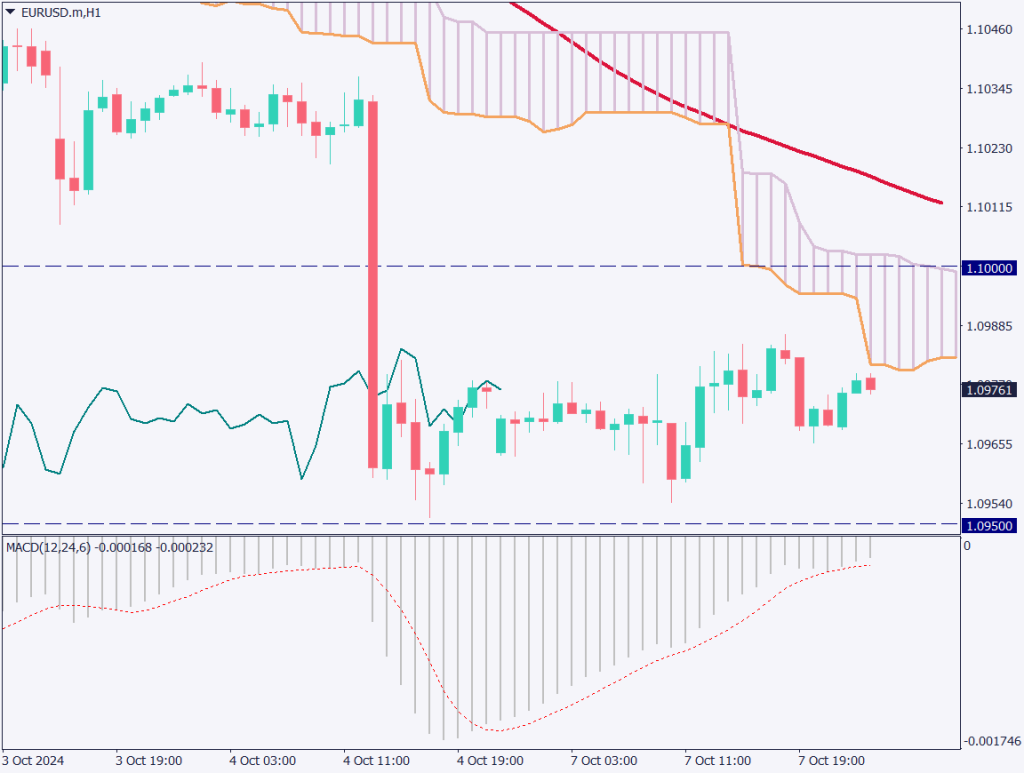
Day trading strategy (1 hour)

Analyzing the 1-hour chart of EURUSD, round numbers play a significant role. The levels of 1.10 USD and 1.0950 USD function as resistance and support lines, respectively. In the 1-hour chart, the pair appears to be in a range, making it difficult to time entries.

Considering the overall movement on the daily chart, selling near 1.10 USD could be a good strategy.

A break below the 90-day moving average on the daily chart could be seen as a sell signal. Watch closely for a break below 1.0950 USD. If EURUSD drops below 1.0950 USD, aggressive selling is recommended. Target profits around 1.0900 USD. If EURUSD rises above 1.10 USD again, it should trigger a stop loss.

Support/Resistance lines

The support and resistance levels to consider going forward are as follows:

  • 1.10 USD: Round number / neckline
  • 1.0950 USD: Recent low
[EURUSD/ H1]

Market Sentiment

EURUSD Short: 18% / Long: 82%

Today’s important economic indicators

Economic indicators and eventsJapan time
Japan Household Spending8:30
Australia RBA Meeting Minutes9:30
Bostic Speech1:45 (next day)
Bundesbank President Speech2:00 (next day)

*Trading advice in this article is not provided by Milton Markets, but by Shu Fujiyasu Jr., a certified technical analyst.

Ready to trade?

Open live account

Related Analysis

Can Gold Renew Its Record High?

Can Gold Renew Its Record High?

10 days agoRead more →
No Currency Intervention Conducted; Reports of Additional Tariffs on South Korea

No Currency Intervention Conducted; Reports of Additional Tariffs on South Korea

20 days agoRead more →
USD/JPY dips slightly on LDP landslide victory

USD/JPY dips slightly on LDP landslide victory

7 days agoRead more →

This material is for informational purposes only and does not constitute investment advice. Trading leveraged products involves significant risk of loss. Past performance is not indicative of future results.

Share

X

Start trading today

  • Fast execution
  • Competitive spreads
  • 24/7 support
Open live accountView account types
Milton Markets
Twitter/XYouTube

Markets

FOREX
CRYPTO
COMMODITIES
INDICES
STOCKS

Trading

  • Flex Account
  • Smart Account
  • Elite Account
  • MetaTrader 5 (MT5)
  • MetaTrader 4 (MT4)
  • Launch WebTrader
  • Learn Hub
  • Economic Calendar
  • Promotions

Company

  • About Us
  • NDD Technology
  • Customer Protection
  • Execution Conditions
  • Company News
  • Blog
  • Market Analysis

Partners

  • IB Program
  • PAMM Program
  • White Label
  • Investor Login
  • Manager Login

Support

  • Terms of Service
  • Privacy Policy
  • Risk Disclosure
  • Contact Us
  • Help Center
  • My Page Login
Milton Markets is a trading name of Milton Markets Ltd. Milton Markets Ltd. is part of Milton Global and is registered in Saint Lucia (Registration Number: 2023-00166). As part of Milton Global, we adhere to the same high regulatory standards as Milton Global Ltd, which is regulated by the Seychelles Financial Services Authority (FSA) under license SD040.
Risk Warning: CFD trading carries high risk and may not suit all investors. You may lose more than your initial investment. Ensure you understand the risks before trading.
Restrictions: Milton Markets does not provide services to the following countries (not limited to these): United States, Canada, European Union countries, Iran, North Korea, Saint Vincent and the Grenadines, Afghanistan, American Samoa, Belarus, Russia, Burundi, Central African Republic, Congo (Brazzaville), Cuba, Iraq, Lebanon, Liberia, Libya, Myanmar, Puerto Rico, Rwanda, Somalia, Sudan, Syria, US Virgin Islands, Venezuela, Yemen, Zimbabwe, Côte d'Ivoire, Mali, Guinea, Eritrea.
You must be 18 years old or the legal age in your country of residence.
By opening an account, you are considered to have registered of your own volition without solicitation from Milton Markets.
Disclaimer: This website does not constitute investment advice. Content should not be construed as personal advice. Seek independent financial advice.
© 2026 Milton Markets. All rights reserved.
TermsPrivacyCookiesRisk