Milton Markets
Markets
Trading
Company
Partners
Sign InOpen Account
  1. Home/
  2. Market Analysis/
  3. Gold Declines Amid Rising U.S. Interest Rates, Increasing Selling Pressure【October 9, 2024】
Koki Ando•Oct 9, 2024

Gold Declines Amid Rising U.S. Interest Rates, Increasing Selling Pressure【October 9, 2024】

Koki Ando headshot

Daily Market Analysis

Koki AndoChief Market Analyst

Expert analysis of today's market movements and trading opportunities

Koki Ando headshot

Daily Market Analysis

Koki AndoChief Market Analyst

Expert analysis of today's market movements and trading opportunities

Fundamental Analysis

  • Gold has fallen for five consecutive days, pressured by rising U.S. 10-year Treasury yields.
  • The stock market’s fear index has risen to around 21, with stock prices fluctuating.
  • Unrest in the Middle East continues, leading to some demand for gold as a safe-haven asset.

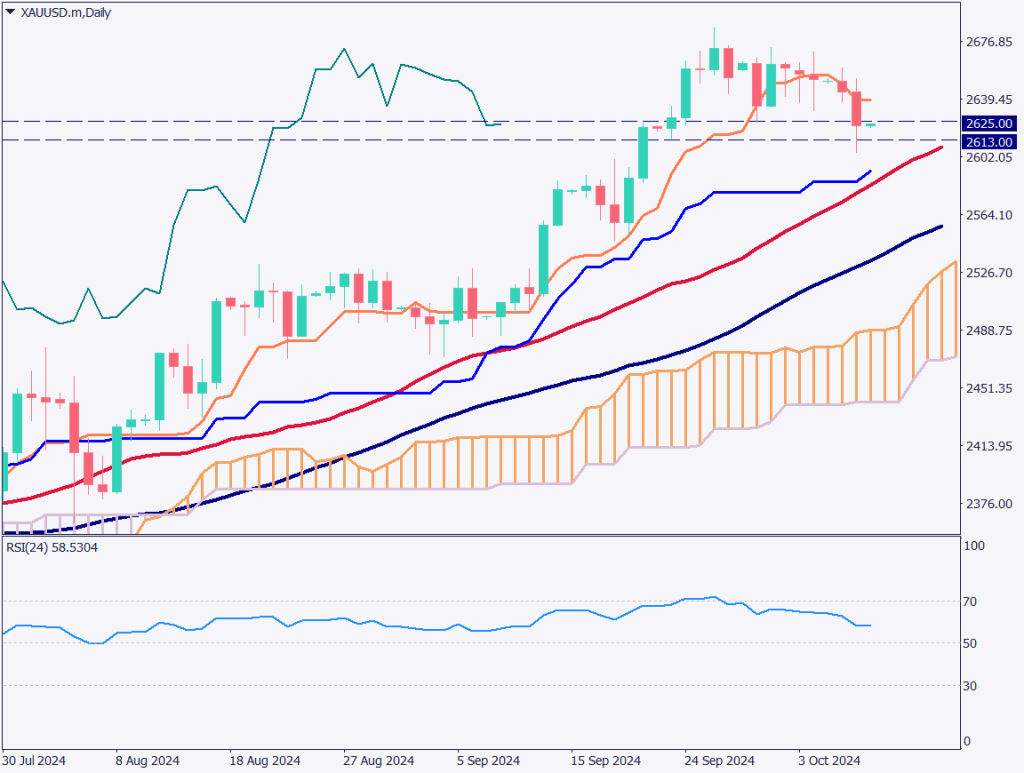
XAUUSD technical analysis

Analyzing the daily chart for gold: gold has fallen below its recent low of 2625 USD and also below the conversion line. Funds are flowing into the U.S. dollar as U.S. 10-year Treasury yields rise, reaching levels not seen since August, creating significant selling pressure on gold.

However, the overall bullish trend is expected to remain unchanged. A small rate cut may be possible, but as long as the U.S. Federal Reserve maintains its rate-cutting stance, I intend to adopt a buy-the-dip strategy for gold. I would consider buying if it dips below the 2600 USD level, which is near the baseline of the Ichimoku Kinko Hyo indicator.

[XAUUSD/ D1]

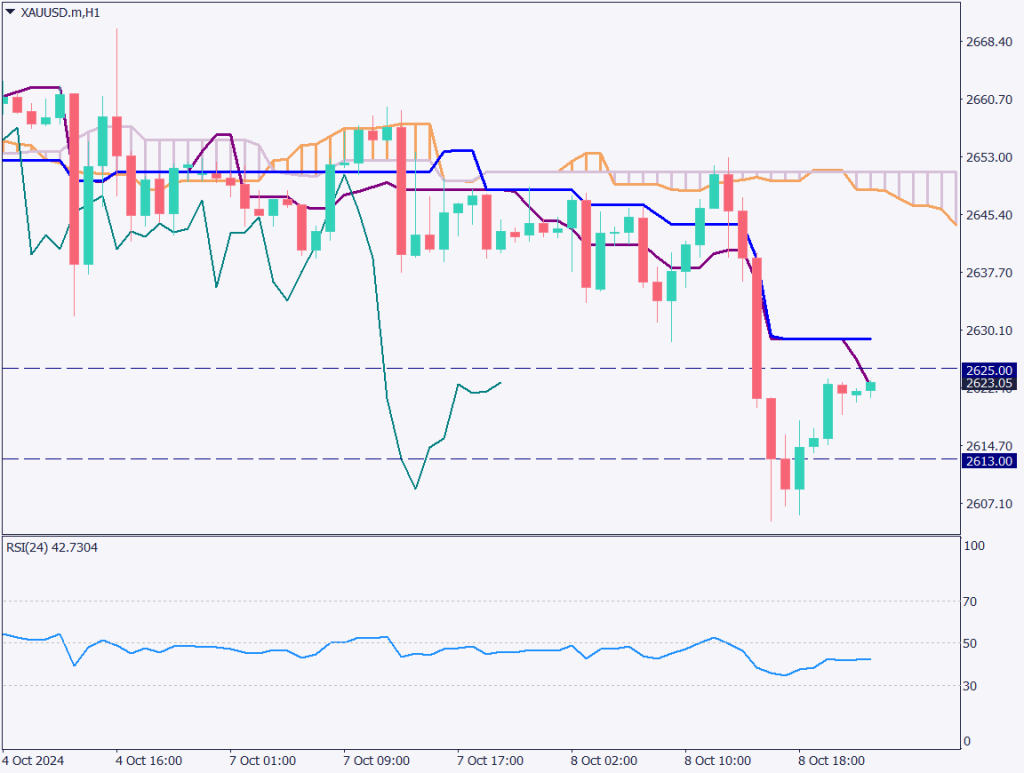
Day trading strategy (1 hour)

Analyzing the 1-hour chart for gold: the market has broken out of a range to the downside, establishing a bearish trend. While this view differs from the daily chart, from a short-term perspective on the 1-hour chart, the strategy is to sell. There is a possibility that gold will test the 2600 USD level. Currently, the conversion line is acting as resistance, and I will watch to see if there is a rebound.

The day trading strategy is to sell.
Enter a sell position at 2625 USD, with a stop if the price exceeds 2628 USD.
Take profit around the 2600 USD level.

Support/Resistance lines

Key support and resistance levels to consider are as follows:

  • 2625 USD: Daily resistance line
  • 2613 USD: Monthly support line
[XAUUSD/ H1]

Market Sentiment

XAUUSD: Sell 49% / Buy 51%

Today’s important economic indicators

Economic indicators and eventsJapan time
New Zealand Policy Rate Announcement
(Forecast: 0.50% rate cut)
10:00
FOMC Member Speech21:00
U.S. Crude Oil Inventory23:30
FOMC Meeting Minutes03:00 (Next Day)

*Trading advice in this article is not provided by Milton Markets, but by Shu Fujiyasu Jr., a certified technical analyst.

Ready to trade?

Open live account

Related Analysis

No Currency Intervention Conducted; Reports of Additional Tariffs on South Korea

No Currency Intervention Conducted; Reports of Additional Tariffs on South Korea

20 days agoRead more →
Gold and Silver Continue to Hit Record Highs

Gold and Silver Continue to Hit Record Highs

19 days agoRead more →
Can Gold Renew Its Record High?

Can Gold Renew Its Record High?

10 days agoRead more →

This material is for informational purposes only and does not constitute investment advice. Trading leveraged products involves significant risk of loss. Past performance is not indicative of future results.

Share

X

Start trading today

  • Fast execution
  • Competitive spreads
  • 24/7 support
Open live accountView account types
Milton Markets
Twitter/XYouTube

Markets

FOREX
CRYPTO
COMMODITIES
INDICES
STOCKS

Trading

  • Flex Account
  • Smart Account
  • Elite Account
  • MetaTrader 5 (MT5)
  • MetaTrader 4 (MT4)
  • Launch WebTrader
  • Learn Hub
  • Economic Calendar
  • Promotions

Company

  • About Us
  • NDD Technology
  • Customer Protection
  • Execution Conditions
  • Company News
  • Blog
  • Market Analysis

Partners

  • IB Program
  • PAMM Program
  • White Label
  • Investor Login
  • Manager Login

Support

  • Terms of Service
  • Privacy Policy
  • Risk Disclosure
  • Contact Us
  • Help Center
  • My Page Login
Milton Markets is a trading name of Milton Markets Ltd. Milton Markets Ltd. is part of Milton Global and is registered in Saint Lucia (Registration Number: 2023-00166). As part of Milton Global, we adhere to the same high regulatory standards as Milton Global Ltd, which is regulated by the Seychelles Financial Services Authority (FSA) under license SD040.
Risk Warning: CFD trading carries high risk and may not suit all investors. You may lose more than your initial investment. Ensure you understand the risks before trading.
Restrictions: Milton Markets does not provide services to the following countries (not limited to these): United States, Canada, European Union countries, Iran, North Korea, Saint Vincent and the Grenadines, Afghanistan, American Samoa, Belarus, Russia, Burundi, Central African Republic, Congo (Brazzaville), Cuba, Iraq, Lebanon, Liberia, Libya, Myanmar, Puerto Rico, Rwanda, Somalia, Sudan, Syria, US Virgin Islands, Venezuela, Yemen, Zimbabwe, Côte d'Ivoire, Mali, Guinea, Eritrea.
You must be 18 years old or the legal age in your country of residence.
By opening an account, you are considered to have registered of your own volition without solicitation from Milton Markets.
Disclaimer: This website does not constitute investment advice. Content should not be construed as personal advice. Seek independent financial advice.
© 2026 Milton Markets. All rights reserved.
TermsPrivacyCookiesRisk