Milton Markets
Markets
Trading
Company
Partners
Sign InOpen Account
  1. Home/
  2. Market Analysis/
  3. EURUSD Drops Sharply as ECB Signals Two Consecutive Rate Cuts【October 18, 2024】
Koki Ando•Oct 18, 2024

EURUSD Drops Sharply as ECB Signals Two Consecutive Rate Cuts【October 18, 2024】

Koki Ando headshot

Daily Market Analysis

Koki AndoChief Market Analyst

Expert analysis of today's market movements and trading opportunities

Koki Ando headshot

Daily Market Analysis

Koki AndoChief Market Analyst

Expert analysis of today's market movements and trading opportunities

Fundamental Analysis

  • The ECB has implemented two consecutive rate cuts to bolster the EU economy.
  • While the ECB moves quickly to lower rates, the Fed’s rate cut may be delayed.
  • This situation is leading to EUR selling and USD buying, and there is a possibility that EURUSD may fall below parity at 1.0.

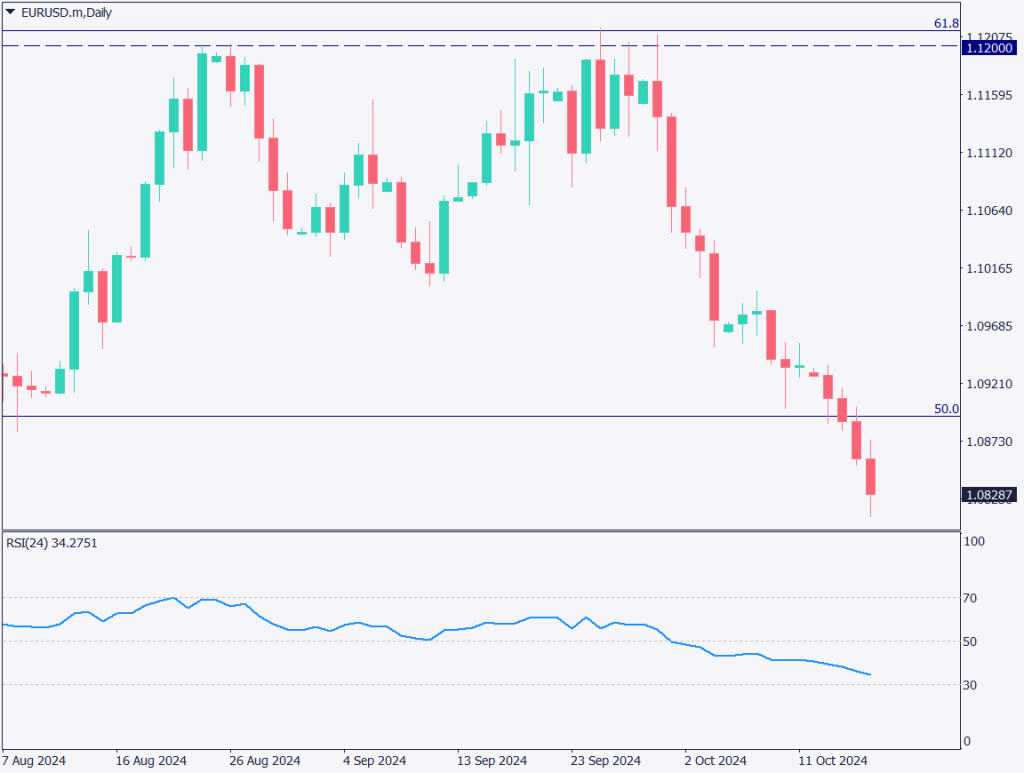
EURUSD technical analysis

Analyzing the daily chart of EURUSD, a double top has formed with a peak at 1.12 USD. The pair has broken below the neckline, strengthening the downtrend. Recently, it also broke below the key level of 1.09 USD on the monthly chart, and after the ECB’s consecutive rate cuts, it has fallen for four straight days.

The EU economy is weakening, with worsening employment conditions. The continued high-interest rate environment is significantly affecting consumption. Meanwhile, U.S. retail sales exceeded expectations, indicating that consumption remains resilient despite high interest rates.

The ECB is likely to continue its rate-cutting policy, while the Fed will be cautious in lowering rates, which may strengthen USD buying relatively. The possibility of Trump’s re-election is also starting to be priced into the market, suggesting the USD-buying trend may continue for some time.

[EURUSD/ D1]

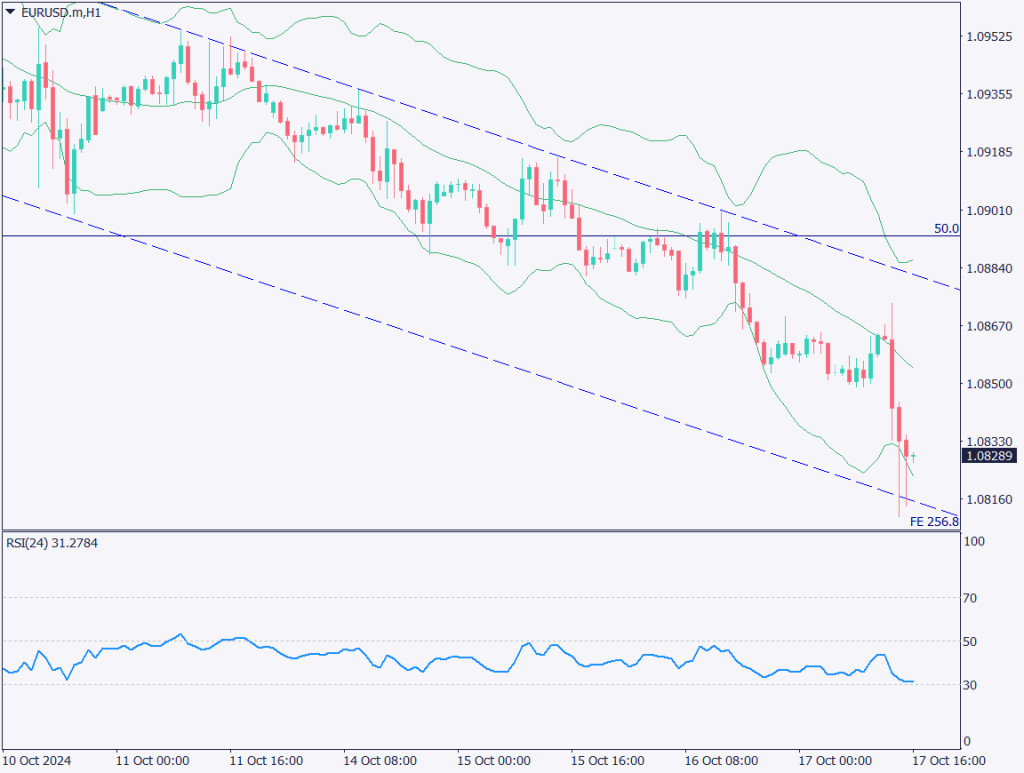
Day trading strategy (1 hour)

Analyzing the 1-hour chart of EURUSD, the pair is confirming a strengthening downtrend while forming a descending channel. After the ECB’s second consecutive rate cut, the pair temporarily broke below the -3σ line of the Bollinger Bands yesterday. A long lower shadow has formed, coinciding with the lower boundary of the descending channel.

Since RSI is at 31, a corrective rebound is likely. Expect a rebound to around 1.0850 USD. The day trading strategy is to sell on the rebound. Enter a sell position around 1.085 USD, which is where the middle Bollinger Band line is trending, and target 1.080 USD, a round number, for take profit. Set the stop at 1.0885 USD.

Support/Resistance lines

The following support and resistance levels should be considered going forward:

  • 1.09 USD: Key resistance on the monthly chart
  • 1.085 USD: Middle Bollinger Band line
  • 1.08 USD: Round number
[EURUSD/ H1]

Market Sentiment

EURUSD Sell: 10% Buy: 90%

Today’s important economic indicators

Economic Indicators and EventsJapan Time
Japan National Consumer Price Index8:30
UK Retail Sales15:00
U.S. Housing Starts21:30
Fed Governor Waller’s Speech1:10 (Next Day)

*Trading advice in this article is not provided by Milton Markets, but by Shu Fujiyasu Jr., a certified technical analyst.

Ready to trade?

Open live account

Related Analysis

USD/JPY dips slightly on LDP landslide victory

USD/JPY dips slightly on LDP landslide victory

7 days agoRead more →
Gold and Silver Continue to Hit Record Highs

Gold and Silver Continue to Hit Record Highs

19 days agoRead more →
Can Gold Renew Its Record High?

Can Gold Renew Its Record High?

10 days agoRead more →

This material is for informational purposes only and does not constitute investment advice. Trading leveraged products involves significant risk of loss. Past performance is not indicative of future results.

Share

X

Start trading today

  • Fast execution
  • Competitive spreads
  • 24/7 support
Open live accountView account types
Milton Markets
Twitter/XYouTube

Markets

FOREX
CRYPTO
COMMODITIES
INDICES
STOCKS

Trading

  • Flex Account
  • Smart Account
  • Elite Account
  • MetaTrader 5 (MT5)
  • MetaTrader 4 (MT4)
  • Launch WebTrader
  • Learn Hub
  • Economic Calendar
  • Promotions

Company

  • About Us
  • NDD Technology
  • Customer Protection
  • Execution Conditions
  • Company News
  • Blog
  • Market Analysis

Partners

  • IB Program
  • PAMM Program
  • White Label
  • Investor Login
  • Manager Login

Support

  • Terms of Service
  • Privacy Policy
  • Risk Disclosure
  • Contact Us
  • Help Center
  • My Page Login
Milton Markets is a trading name of Milton Markets Ltd. Milton Markets Ltd. is part of Milton Global and is registered in Saint Lucia (Registration Number: 2023-00166). As part of Milton Global, we adhere to the same high regulatory standards as Milton Global Ltd, which is regulated by the Seychelles Financial Services Authority (FSA) under license SD040.
Risk Warning: CFD trading carries high risk and may not suit all investors. You may lose more than your initial investment. Ensure you understand the risks before trading.
Restrictions: Milton Markets does not provide services to the following countries (not limited to these): United States, Canada, European Union countries, Iran, North Korea, Saint Vincent and the Grenadines, Afghanistan, American Samoa, Belarus, Russia, Burundi, Central African Republic, Congo (Brazzaville), Cuba, Iraq, Lebanon, Liberia, Libya, Myanmar, Puerto Rico, Rwanda, Somalia, Sudan, Syria, US Virgin Islands, Venezuela, Yemen, Zimbabwe, Côte d'Ivoire, Mali, Guinea, Eritrea.
You must be 18 years old or the legal age in your country of residence.
By opening an account, you are considered to have registered of your own volition without solicitation from Milton Markets.
Disclaimer: This website does not constitute investment advice. Content should not be construed as personal advice. Seek independent financial advice.
© 2026 Milton Markets. All rights reserved.
TermsPrivacyCookiesRisk