Milton Markets
Markets
Trading
Company
Partners
Sign InOpen Account
  1. Home/
  2. Market Analysis/
  3. Gold Reaches Historic High of Over 2700 USD, Supported by Fundamentals Despite Overbought Conditions【October 21, 2024】
Koki Ando•Oct 21, 2024

Gold Reaches Historic High of Over 2700 USD, Supported by Fundamentals Despite Overbought Conditions【October 21, 2024】

Koki Ando headshot

Daily Market Analysis

Koki AndoChief Market Analyst

Expert analysis of today's market movements and trading opportunities

Koki Ando headshot

Daily Market Analysis

Koki AndoChief Market Analyst

Expert analysis of today's market movements and trading opportunities

Fundamental Analysis

  • Israel assassinates Hamas leader Sinwar; Iran’s influence grows
  • Ongoing unrest in the Middle East, and the U.S. presidential election shake the markets
  • Gold surges to a historic high of over 2700 USD, driven by demand for safe-haven assets

XAUUSD technical analysis

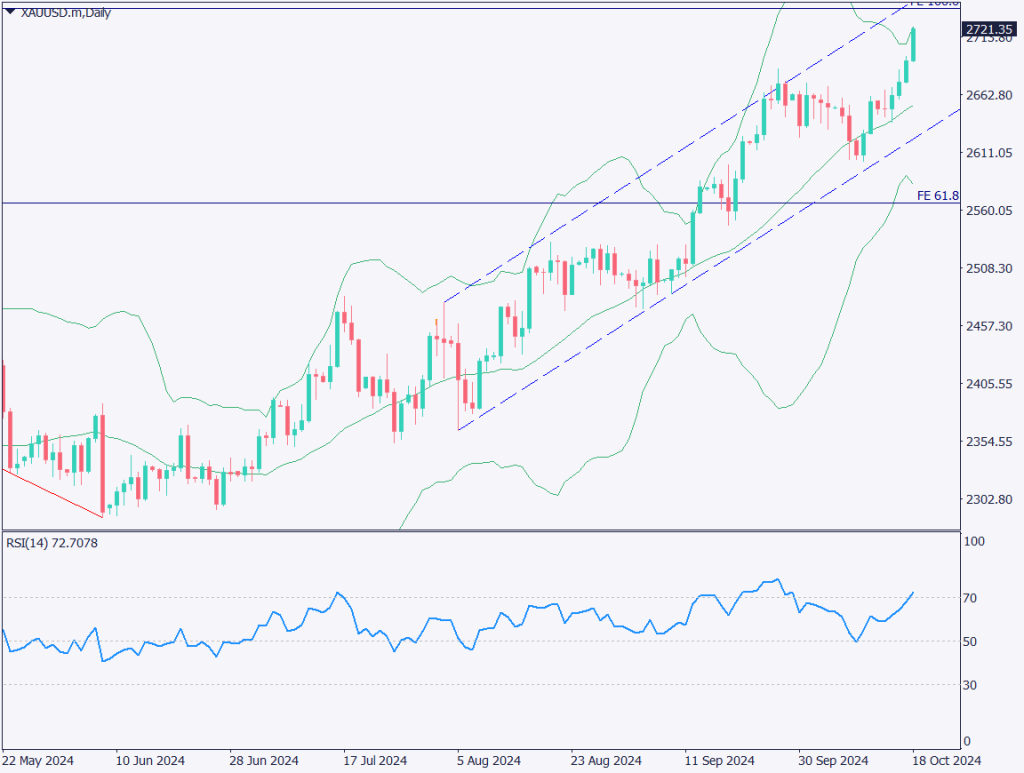
Analyzing the daily chart of gold: Gold has touched the +3σ line of the Bollinger Bands. The +3σ line indicates that 99.7% of candlesticks remain within this band, and breaking above it suggests a higher probability of a price correction.

Gold has reached the 2700 USD range for the first time, surging to 2720 USD due to stop-loss orders. A pullback is expected at the start of the week. Historically, gold has gone through adjustment phases whenever it entered new price ranges.

With no signs of stability in the Middle East and the U.S. presidential election becoming increasingly unpredictable, the fundamentals suggest continued buying during price dips.

[XAUUSD/ D1]

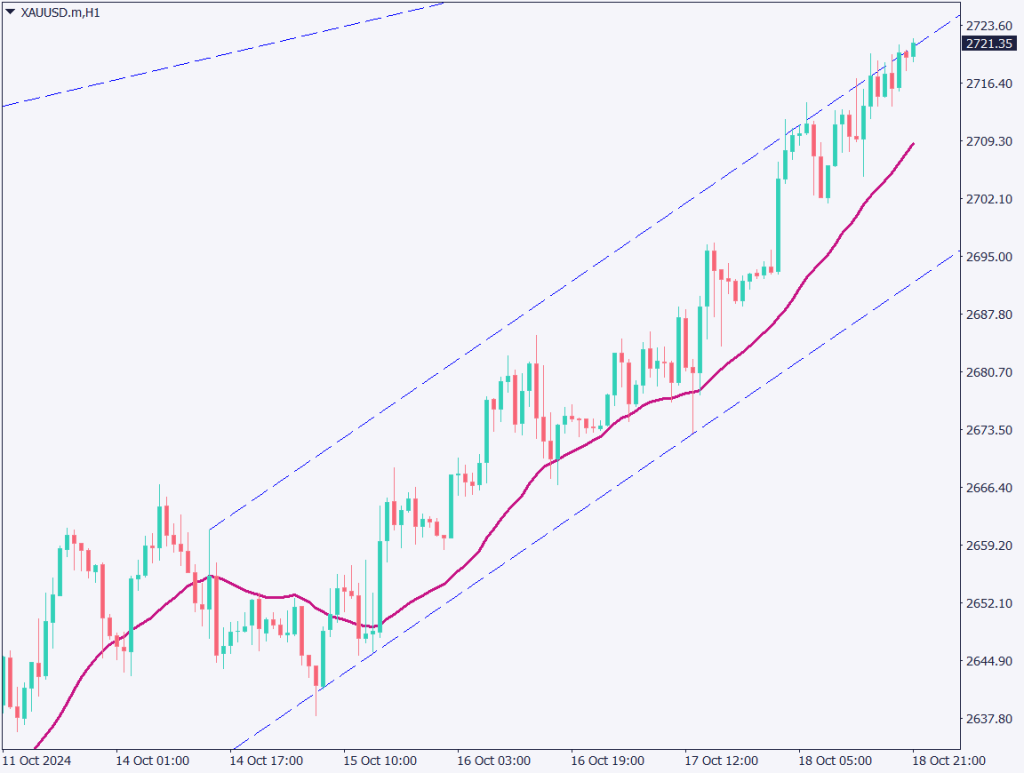
Day trading strategy (1 hour)

Analyzing the 1-hour chart of gold: Gold is forming an upward channel and is sticking to the upper boundary line. The probability of a pullback is high, so caution is advised when holding long positions in the 2700 USD range. With the price deviating from the 10MA, it could drop to the lower 2700 USD range.

The day trading strategy focuses on buying the dips. Setting a deep buy limit order would be ideal. The best scenario is buying the dip around the 10MA at 2710 USD or the channel’s lower boundary near 2695 USD. Although the precise point of correction is uncertain, buying on the dips should be prioritized.

However, given that gold is near the +3σ line on the daily chart, short positions could also be considered for short-term trading.

Support/Resistance lines

The following support and resistance levels should be considered going forward:

  • 2740 USD: Fibonacci expansion 100%
  • 2700 USD: Round number
[XAUUSD/ H1]

Market Sentiment

XAUUSD Sell: 65% Buy: 35%

Today’s important economic indicators

Economic Indicators and EventsJapan Time
U.S. Leading Economic Index23:00
FOMC Member Speech02:00 (next day)

*Trading advice in this article is not provided by Milton Markets, but by Shu Fujiyasu Jr., a certified technical analyst.

Ready to trade?

Open live account

Related Analysis

No Currency Intervention Conducted; Reports of Additional Tariffs on South Korea

No Currency Intervention Conducted; Reports of Additional Tariffs on South Korea

20 days agoRead more →
Can Gold Renew Its Record High?

Can Gold Renew Its Record High?

10 days agoRead more →
Gold and Silver Continue to Hit Record Highs

Gold and Silver Continue to Hit Record Highs

19 days agoRead more →

This material is for informational purposes only and does not constitute investment advice. Trading leveraged products involves significant risk of loss. Past performance is not indicative of future results.

Share

X

Start trading today

  • Fast execution
  • Competitive spreads
  • 24/7 support
Open live accountView account types
Milton Markets
Twitter/XYouTube

Markets

FOREX
CRYPTO
COMMODITIES
INDICES
STOCKS

Trading

  • Flex Account
  • Smart Account
  • Elite Account
  • MetaTrader 5 (MT5)
  • MetaTrader 4 (MT4)
  • Launch WebTrader
  • Learn Hub
  • Economic Calendar
  • Promotions

Company

  • About Us
  • NDD Technology
  • Customer Protection
  • Execution Conditions
  • Company News
  • Blog
  • Market Analysis

Partners

  • IB Program
  • PAMM Program
  • White Label
  • Investor Login
  • Manager Login

Support

  • Terms of Service
  • Privacy Policy
  • Risk Disclosure
  • Contact Us
  • Help Center
  • My Page Login
Milton Markets is a trading name of Milton Markets Ltd. Milton Markets Ltd. is part of Milton Global and is registered in Saint Lucia (Registration Number: 2023-00166). As part of Milton Global, we adhere to the same high regulatory standards as Milton Global Ltd, which is regulated by the Seychelles Financial Services Authority (FSA) under license SD040.
Risk Warning: CFD trading carries high risk and may not suit all investors. You may lose more than your initial investment. Ensure you understand the risks before trading.
Restrictions: Milton Markets does not provide services to the following countries (not limited to these): United States, Canada, European Union countries, Iran, North Korea, Saint Vincent and the Grenadines, Afghanistan, American Samoa, Belarus, Russia, Burundi, Central African Republic, Congo (Brazzaville), Cuba, Iraq, Lebanon, Liberia, Libya, Myanmar, Puerto Rico, Rwanda, Somalia, Sudan, Syria, US Virgin Islands, Venezuela, Yemen, Zimbabwe, Côte d'Ivoire, Mali, Guinea, Eritrea.
You must be 18 years old or the legal age in your country of residence.
By opening an account, you are considered to have registered of your own volition without solicitation from Milton Markets.
Disclaimer: This website does not constitute investment advice. Content should not be construed as personal advice. Seek independent financial advice.
© 2026 Milton Markets. All rights reserved.
TermsPrivacyCookiesRisk