Milton Markets
Markets
Trading
Company
Partners
Sign InOpen Account
  1. Home/
  2. Market Analysis/
  3. USDJPY Trading in the Upper 151 JPY Range, Likely Driven by US Presidential Election-Inspired USD Buying【October 22, 2024】
Koki Ando•Oct 22, 2024

USDJPY Trading in the Upper 151 JPY Range, Likely Driven by US Presidential Election-Inspired USD Buying【October 22, 2024】

Koki Ando headshot

Daily Market Analysis

Koki AndoChief Market Analyst

Expert analysis of today's market movements and trading opportunities

Koki Ando headshot

Daily Market Analysis

Koki AndoChief Market Analyst

Expert analysis of today's market movements and trading opportunities

Fundamental Analysis

  • USDJPY is rising into the upper 150 JPY range, with election-related trading driving USD buying.
  • Overall, the forex market is seeing a continued rise in USD demand, while stock indices are facing profit-taking pressures.
  • USDJPY is facing strong resistance at the 151 JPY level, with the 10-day moving average (MA) acting as a support line.

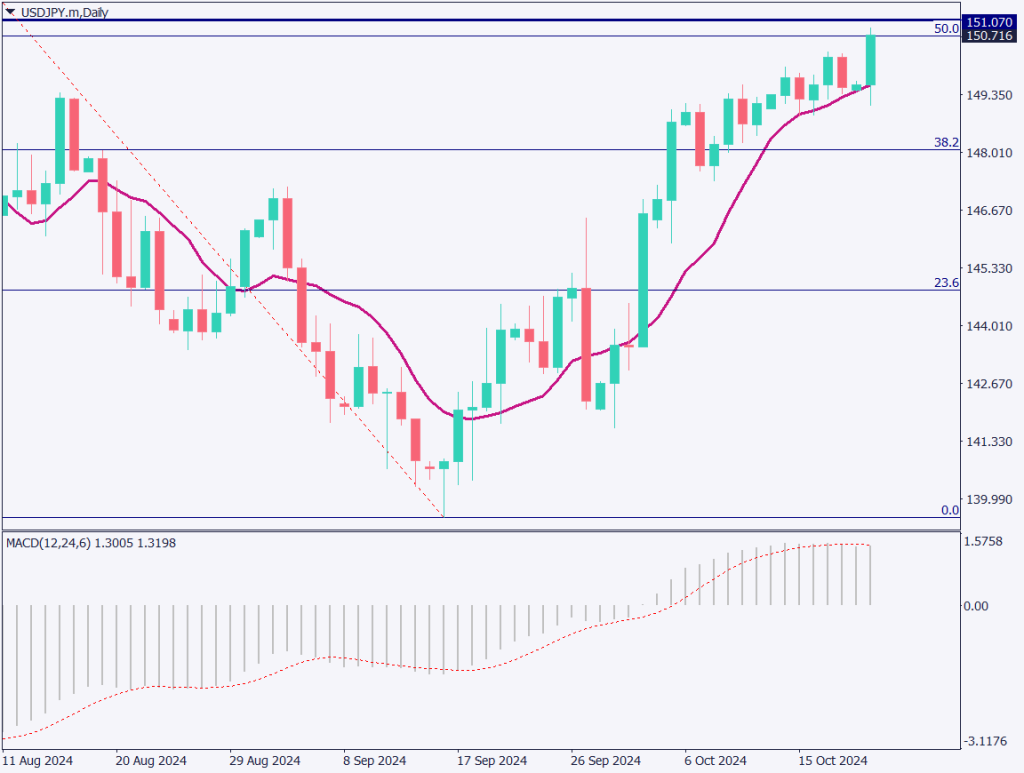
USDJPY technical analysis

Let’s analyze the daily USDJPY chart. The pair is pushing towards the 151 JPY level. Historically, the 10-day MA tends to serve as a support line in strong markets, and this time too, the pair has rebounded from the 10-day MA, reaching new highs.

When applying a Fibonacci retracement to the recent major downtrend, the 50% retracement level is found at 150.70 JPY. The 50% retracement line is considered an important level, where selling pressure tends to peak. Additionally, 151.070 JPY marks the R2 resistance on the monthly pivot, which is a very strong resistance level.

Looking at the MACD, the histogram is starting to fall below the signal line, indicating a possible weakening in the bullish trend. The focus will be whether USDJPY can break clearly above the 151.070 JPY level.

[USDJPY/ D1]

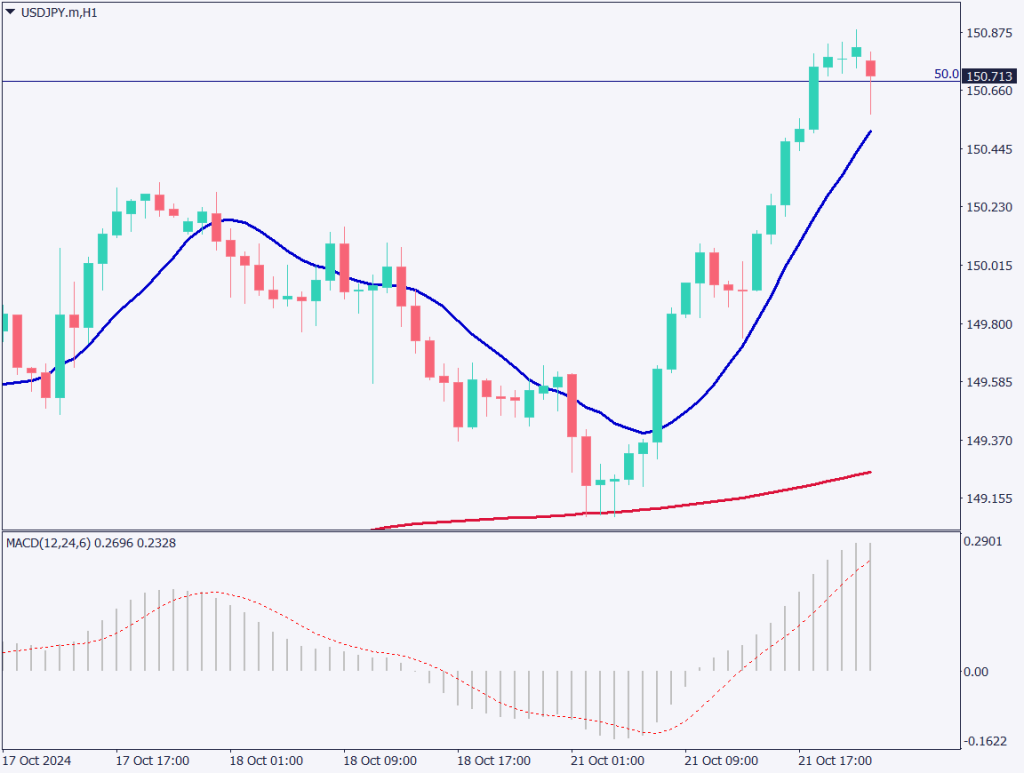
Day trading strategy (1 hour)

Next, we analyze the 1-hour USDJPY chart. On the 1-hour chart, USDJPY continues to rise with support from the 10-hour MA. It has risen to 150.88 JPY, and there seems to be some profit-taking as the market reaches this level. The 240-hour MA is also being noted, which is interesting.

With US stock indices also entering a corrective selling market, we may see USDJPY’s rise pause. It could be an opportunity for a counter-trade, selling around the 151 JPY level.

The day trading strategy is to initiate a new sell position at 151.07 JPY, set a stop-loss at 151.25 JPY, and aim for profit-taking around 150.35 JPY.

Support/Resistance lines

The following support and resistance levels should be considered going forward:

  • 151.00 JPY: Round number / Monthly resistance line
  • 150.30 JPY: Fibonacci 50% retracement
[USDJPY/ H1]

Market Sentiment

USDJPY Sell: 75% Buy: 25%

Today’s important economic indicators

Economic Indicators and EventsJapan Time
Bank of Japan Core CPI14:00
Speech by Deutsche Bundesbank President Nagel22:15
Speech by BOE Governor Bailey22:25
Speech by FOMC Member Harker23:00
Speech by ECB President Lagarde04:15 (Next day)

*Trading advice in this article is not provided by Milton Markets, but by Shu Fujiyasu Jr., a certified technical analyst.

Ready to trade?

Open live account

Related Analysis

USD/JPY Forms a Range — What’s Next?

USD/JPY Forms a Range — What’s Next?

TodayRead more →
Can Gold Renew Its Record High?

Can Gold Renew Its Record High?

10 days agoRead more →
USD/JPY: Selling Pressure Dominates on Rallies

USD/JPY: Selling Pressure Dominates on Rallies

6 days agoRead more →

This material is for informational purposes only and does not constitute investment advice. Trading leveraged products involves significant risk of loss. Past performance is not indicative of future results.

Share

X

Start trading today

  • Fast execution
  • Competitive spreads
  • 24/7 support
Open live accountView account types
Milton Markets
Twitter/XYouTube

Markets

FOREX
CRYPTO
COMMODITIES
INDICES
STOCKS

Trading

  • Flex Account
  • Smart Account
  • Elite Account
  • MetaTrader 5 (MT5)
  • MetaTrader 4 (MT4)
  • Launch WebTrader
  • Learn Hub
  • Economic Calendar
  • Promotions

Company

  • About Us
  • NDD Technology
  • Customer Protection
  • Execution Conditions
  • Company News
  • Blog
  • Market Analysis

Partners

  • IB Program
  • PAMM Program
  • White Label
  • Investor Login
  • Manager Login

Support

  • Terms of Service
  • Privacy Policy
  • Risk Disclosure
  • Contact Us
  • Help Center
  • My Page Login
Milton Markets is a trading name of Milton Markets Ltd. Milton Markets Ltd. is part of Milton Global and is registered in Saint Lucia (Registration Number: 2023-00166). As part of Milton Global, we adhere to the same high regulatory standards as Milton Global Ltd, which is regulated by the Seychelles Financial Services Authority (FSA) under license SD040.
Risk Warning: CFD trading carries high risk and may not suit all investors. You may lose more than your initial investment. Ensure you understand the risks before trading.
Restrictions: Milton Markets does not provide services to the following countries (not limited to these): United States, Canada, European Union countries, Iran, North Korea, Saint Vincent and the Grenadines, Afghanistan, American Samoa, Belarus, Russia, Burundi, Central African Republic, Congo (Brazzaville), Cuba, Iraq, Lebanon, Liberia, Libya, Myanmar, Puerto Rico, Rwanda, Somalia, Sudan, Syria, US Virgin Islands, Venezuela, Yemen, Zimbabwe, Côte d'Ivoire, Mali, Guinea, Eritrea.
You must be 18 years old or the legal age in your country of residence.
By opening an account, you are considered to have registered of your own volition without solicitation from Milton Markets.
Disclaimer: This website does not constitute investment advice. Content should not be construed as personal advice. Seek independent financial advice.
© 2026 Milton Markets. All rights reserved.
TermsPrivacyCookiesRisk